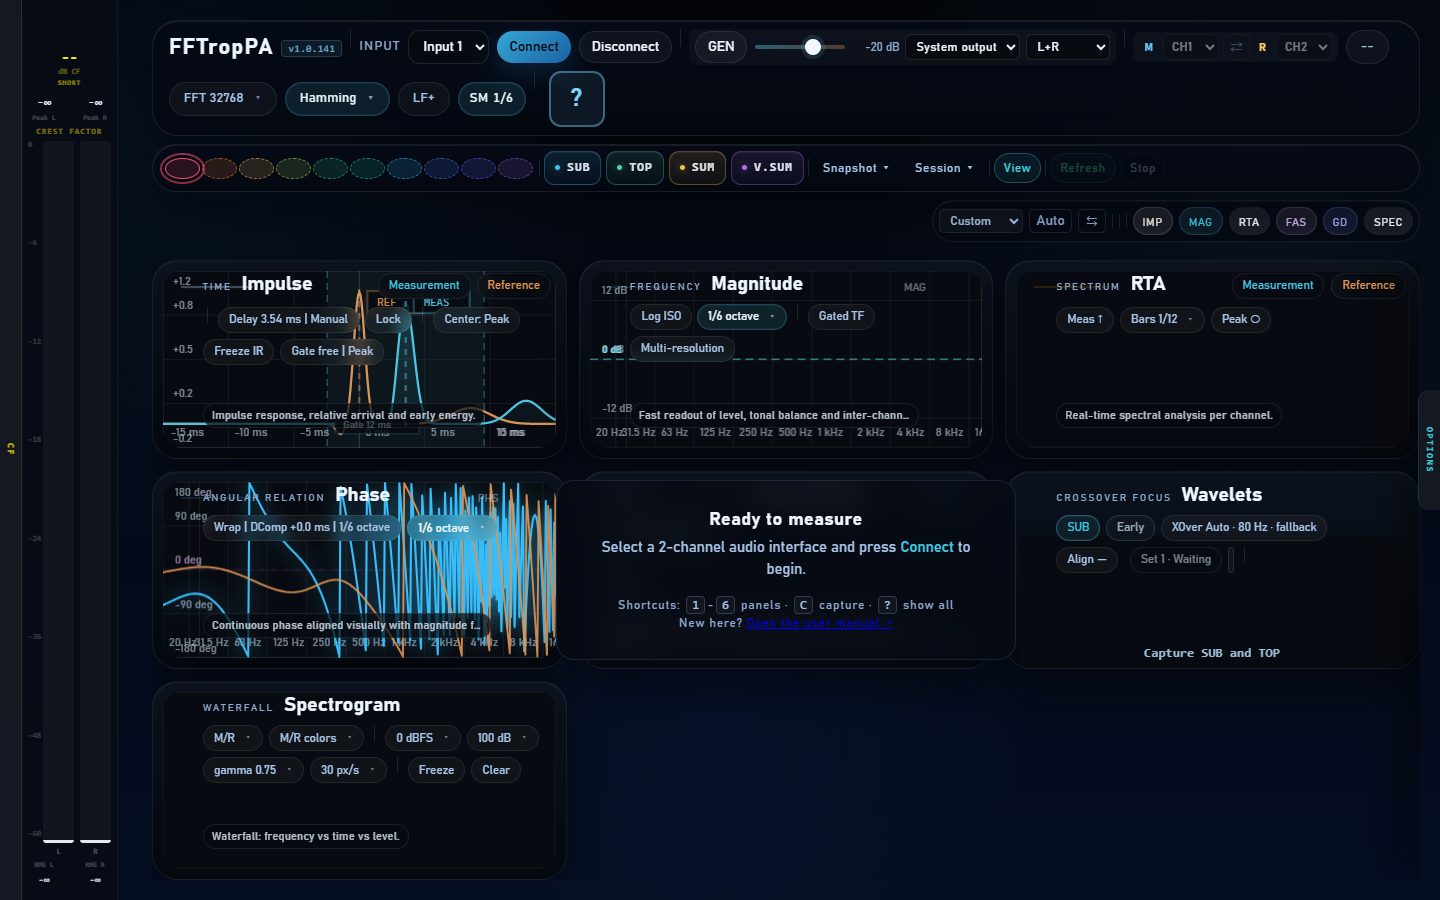
Dual-channel Transfer Function Analyzer
Complete technical reference of every surface, control, chip,
slider, panel, mode and shortcut of the FFTropPA software as it
exists on main. Generated from the source code itself
and from real screenshots of the running app.
Overview
FFTropPA is a dual-channel transfer function analyzer for live acoustic measurement that runs 100% in the browser (browser-only, no backend). It targets the workflow of a system engineer or PA tuner: comparing a reference signal against a microphone-captured signal to extract the system response in magnitude, phase, coherence, delay and impulse response.
Technical stack
| Layer | Technology | Notes |
|---|---|---|
| Language | JavaScript ES modules | no TypeScript, no framework |
| UI | Vanilla DOM + custom CSS | index.html 956 lines, style.css 3045 lines |
| State | Custom path-based store | store.js 299 lines; get/set/subscribe API |
| Audio | Web Audio API + AudioWorklet | pink-noise-worklet.js |
| Render | Canvas 2D | 7 independent canvases |
| Persistence | localStorage | snapshots, sessions, prefs, work-mode |
| Deploy | Azure Static Web Apps | no network at runtime (connect-src 'none') |
Domain concepts
- Transfer function (TF). Complex quotient
Y(f)/X(f)between the spectrum of the measured signal (Y) and the reference signal (X). Yields magnitude, phase and coherence. - Coherence. How correlated measurement and reference are in each frequency band (0 to 1). Indicates measurement quality.
- Impulse response (IR). Inverse transform of the TF — the time-domain response of the system under test.
- Delay. Time between the reference pulse and its arrival at the measurement point.
- Gate. Time window applied to the IR to discard late reflections.
- RTA. Real-time spectrum, instantaneous power, no reference.
- CWT. Continuous Wavelet Transform — time-frequency analysis with scale-dependent resolution.
- Crest factor. Peak / RMS ratio of the signal. Effective headroom.
UI anatomy
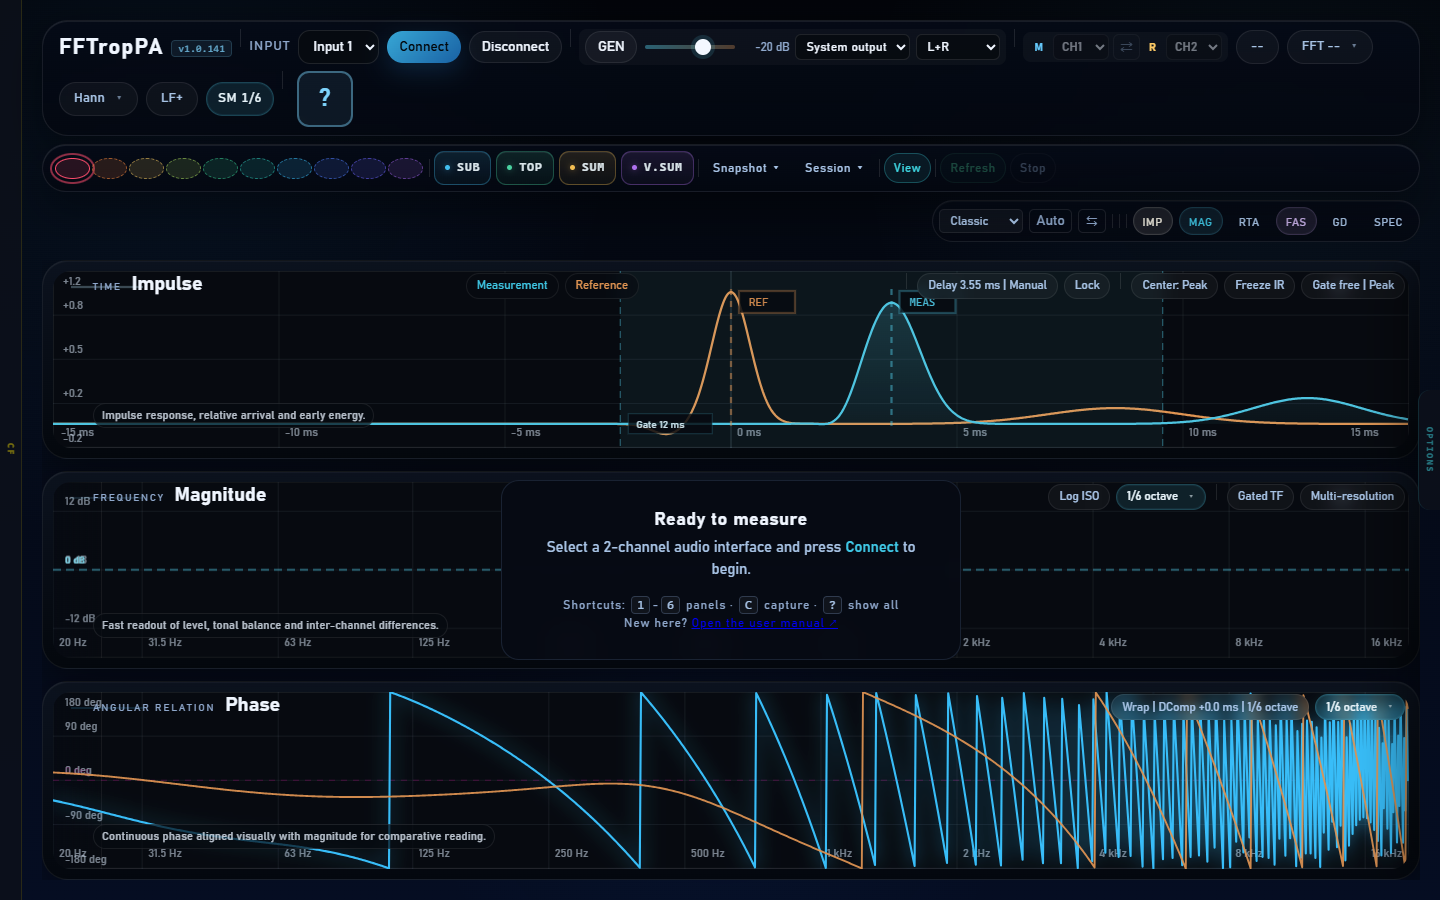
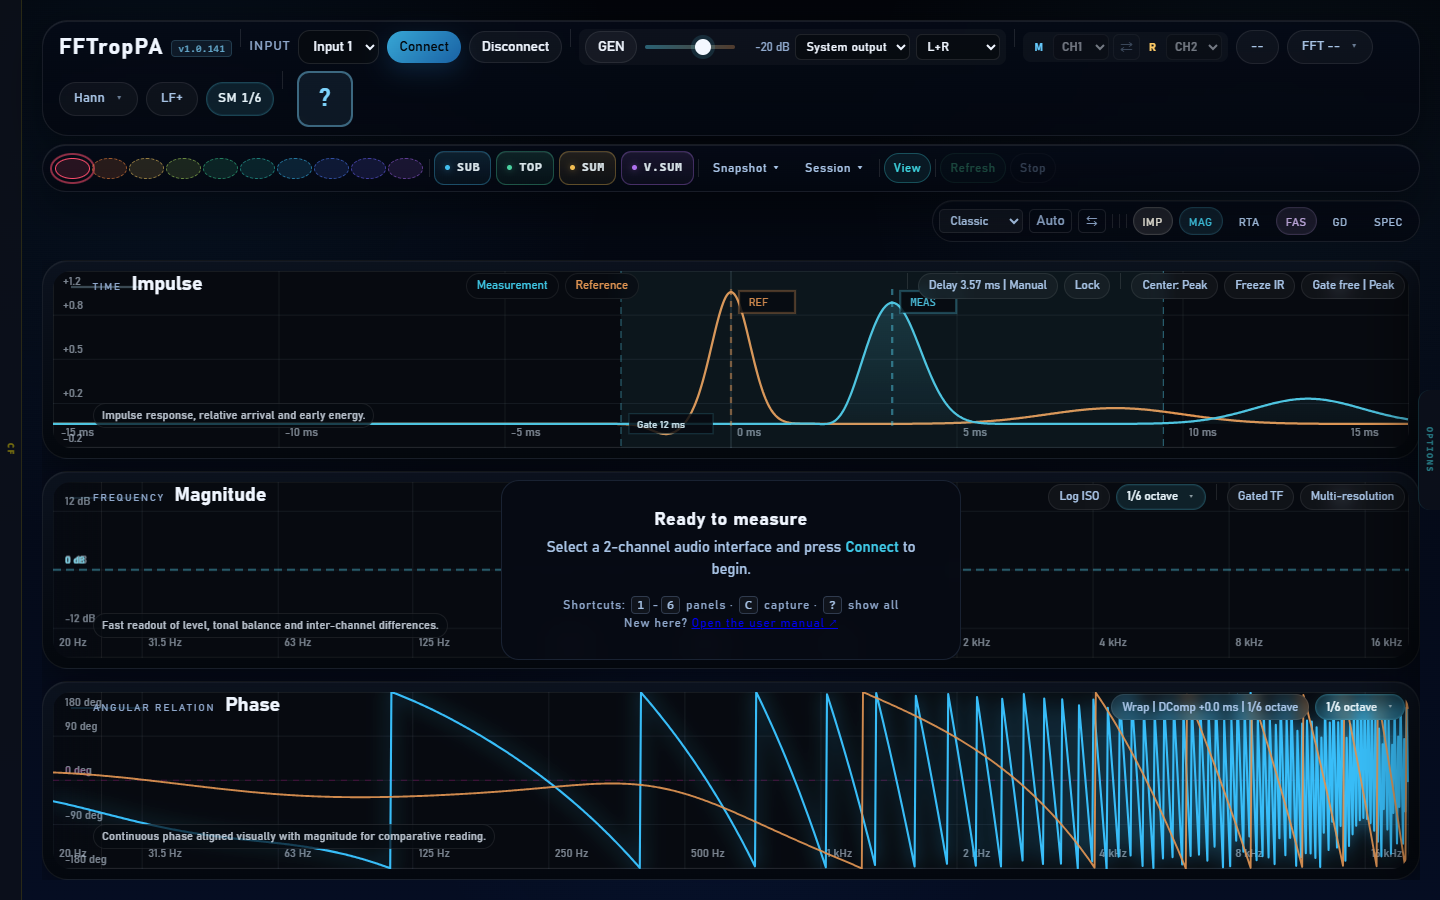
The UI has three main regions: a fixed topbar with all the operative controls, a central tileable graph stage that shows up to 7 panels at once, and two side towers — the Crest Factor Tower on the left and the Options Tower on the right.
Topbar
The topbar concentrates every operative control and stays always visible.
3.1 Snapshot bar
On the left side of the header. Ten capture slots whose palette follows a perceptual sequence ( ), plus two dropdown menus — Snapshot ▾ and Session ▾ — and the controls View, Refresh, Stop, GEN.
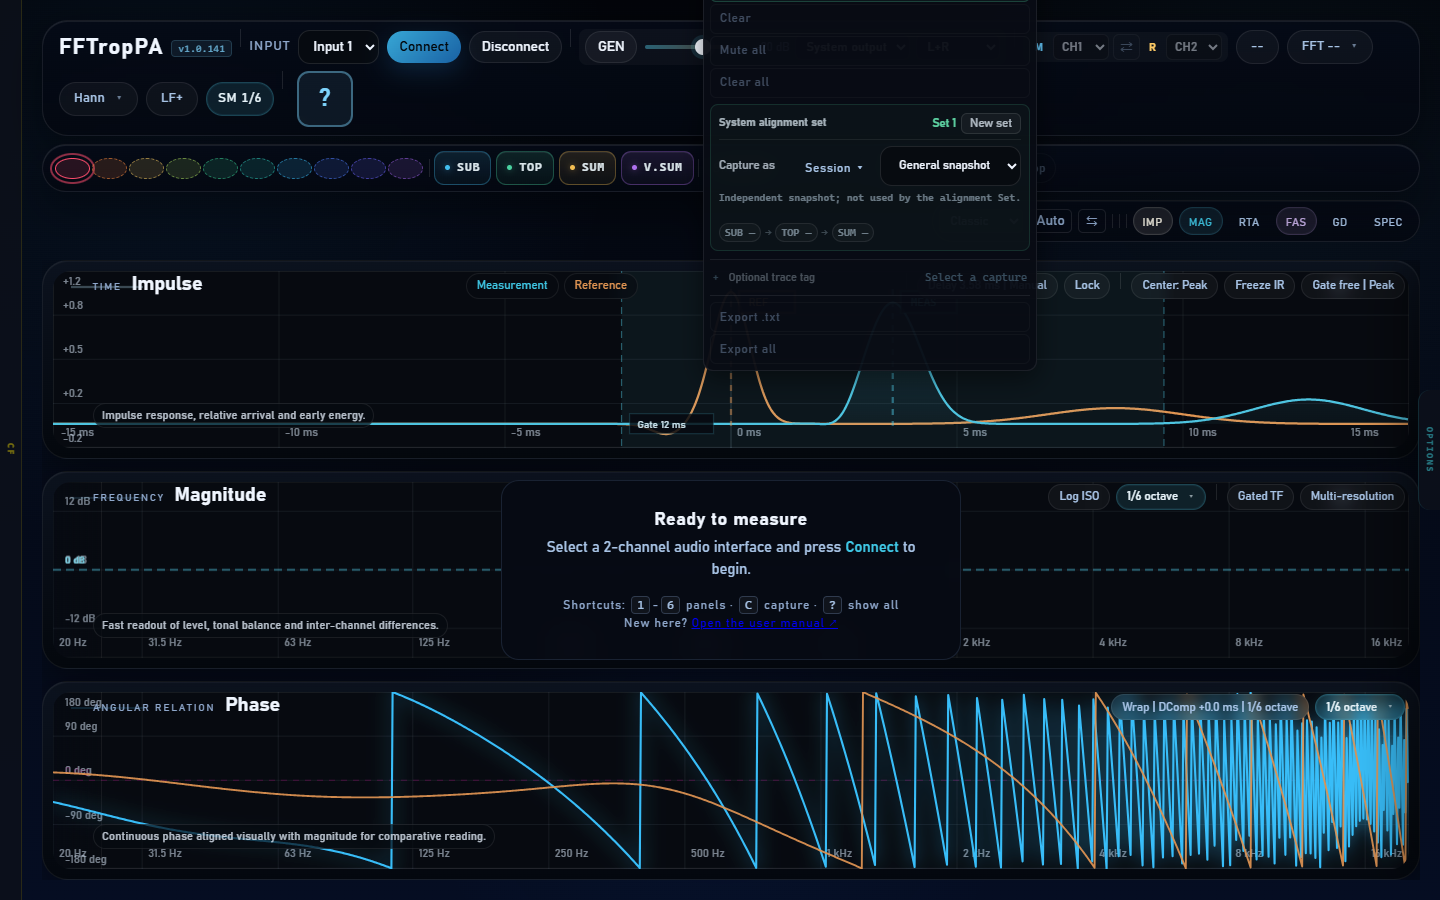
Snapshot ▾ menu open
showing Capture, Clear, Clear all, Export .txt, Export all.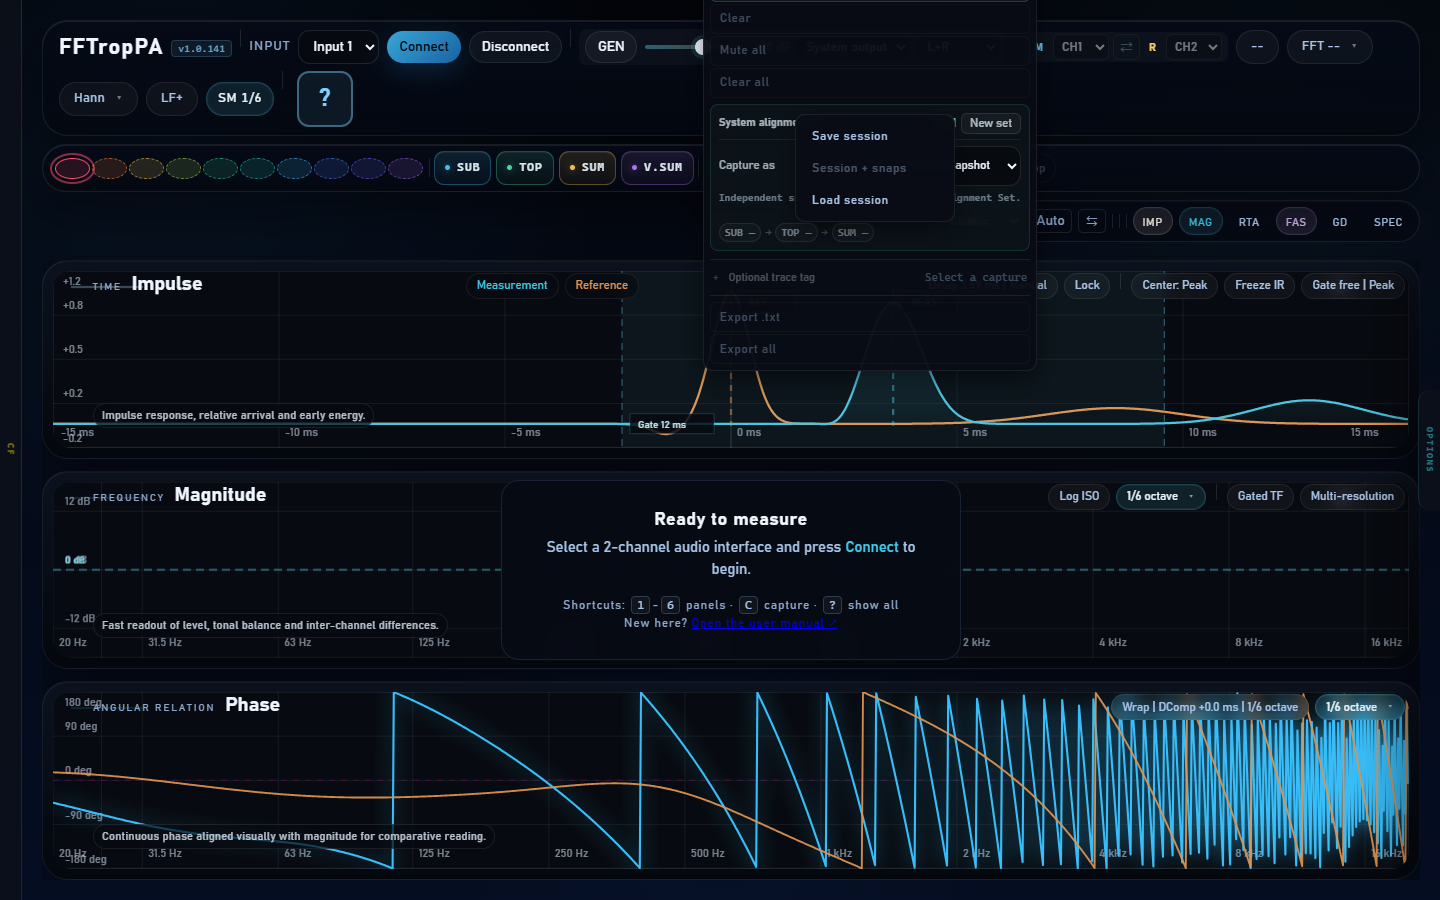
Session ▾ menu open:
Save session, Session + snaps, Load session.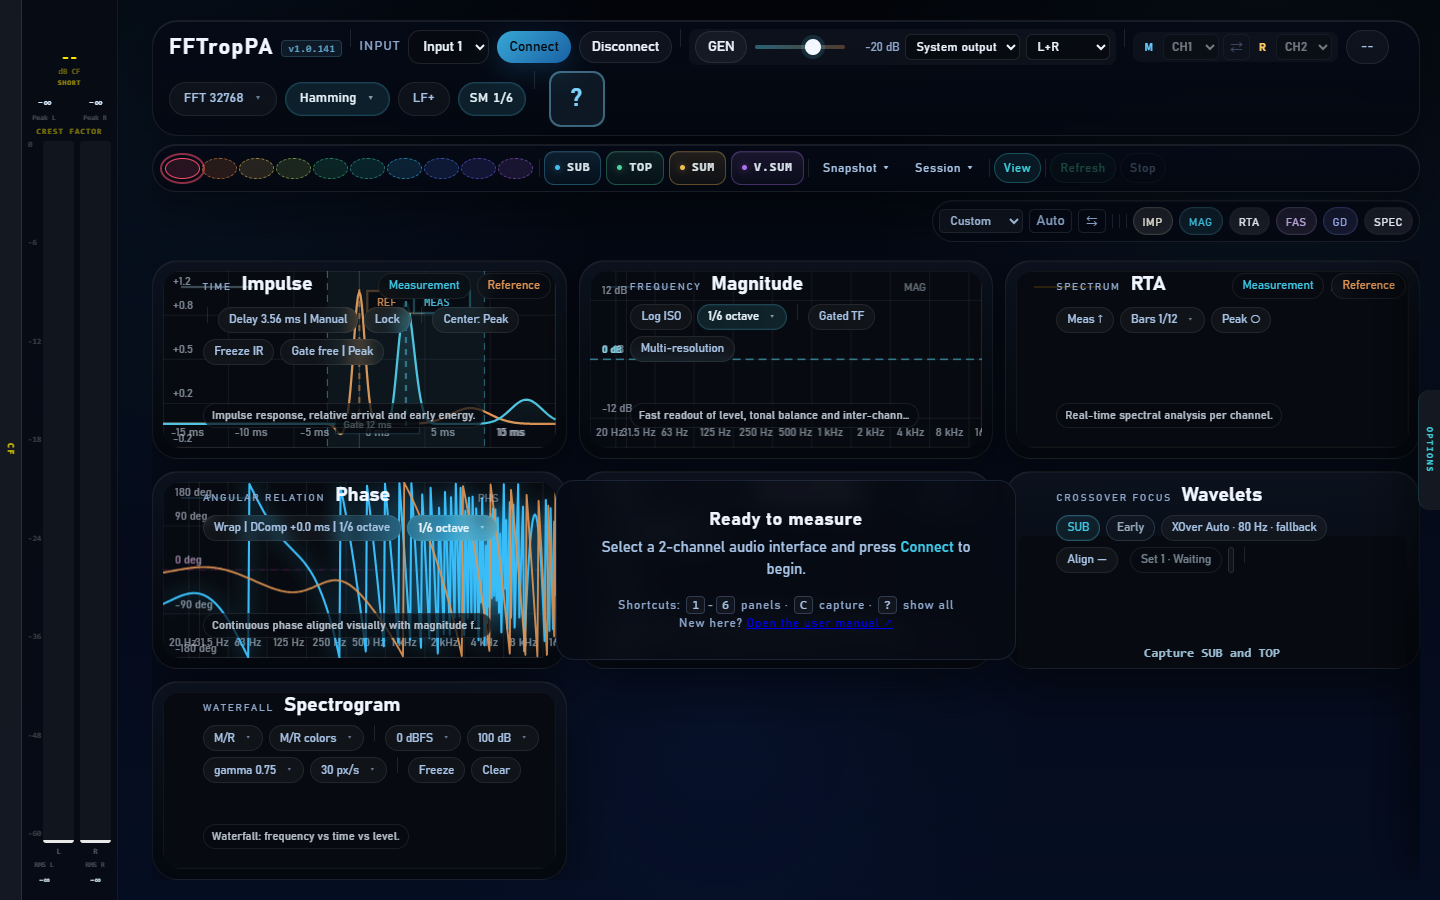
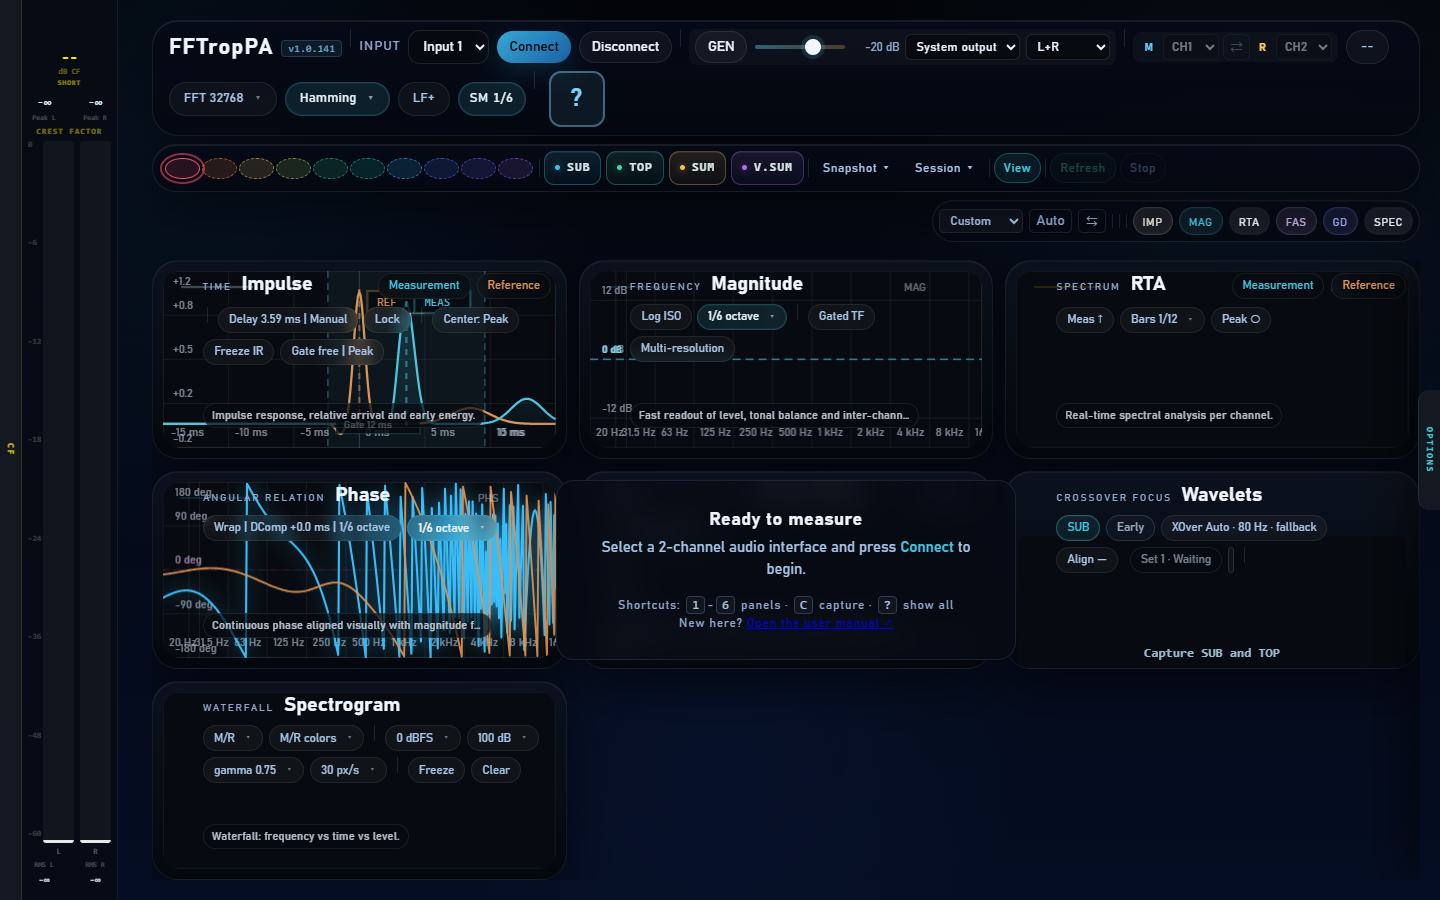
3.4 Channel router
Decides which input channel is assigned as Measurement (M)
and which as Reference (R). The ⇄ button
swaps the assignment.
3.5 Status pills (DSP parameters)
| Pill | Values |
|---|---|
| 48000 Hz Sample rate | Read-only (44100 / 48000 / 96000) |
| FFT 16384 FFT size | 512 / 1024 / 2048 / 4096 / 8192 / 16384 / 32768 |
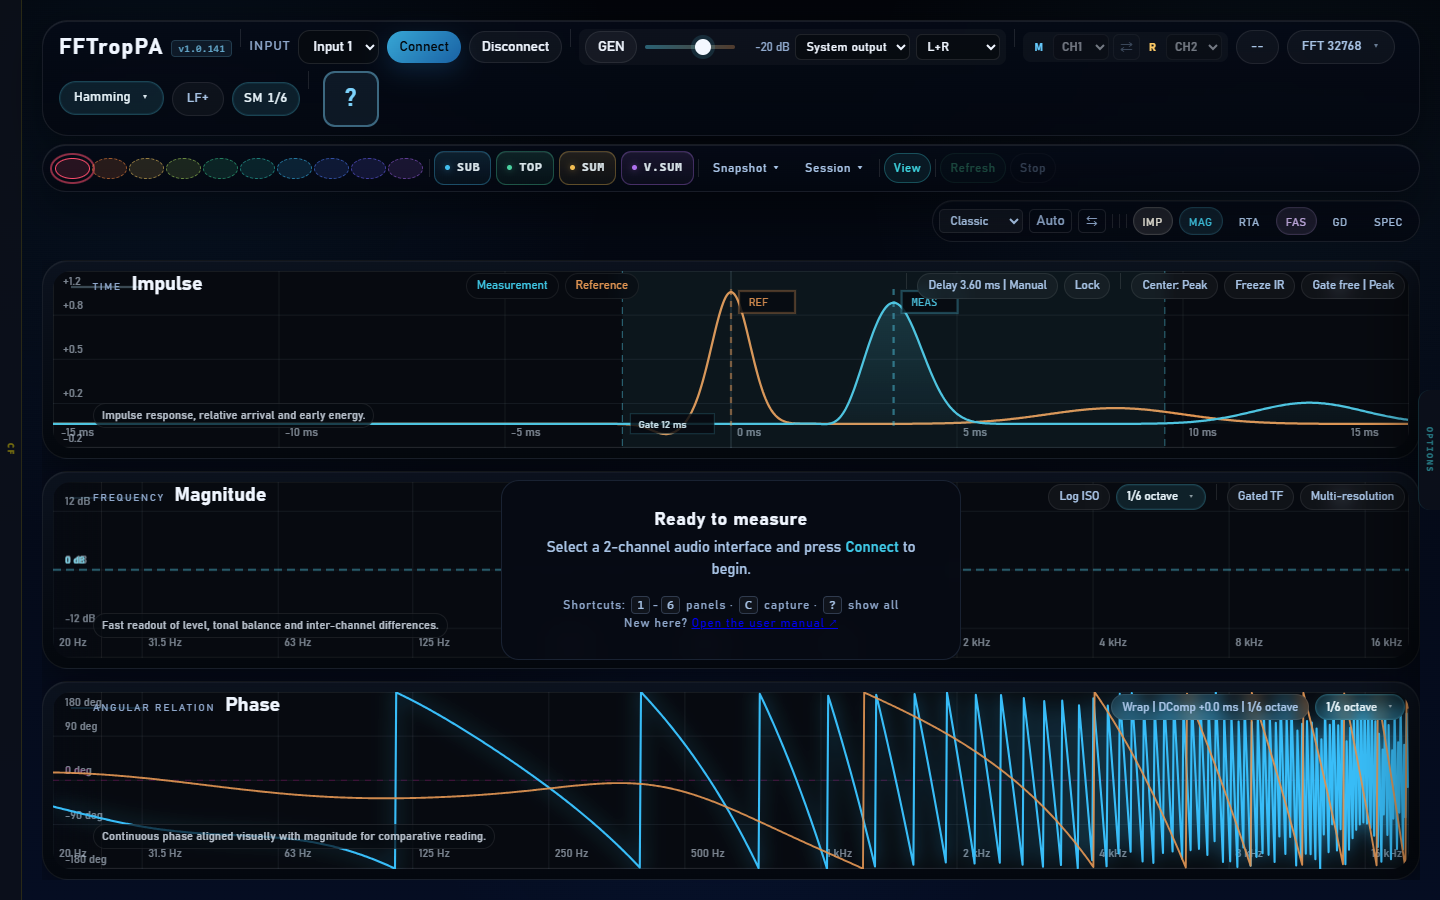
| Hann Window | Hann / Hamming / Blackman / Blackman-Harris / Flat-Top / Tukey / Rect |
| LF+ LF pipeline | FFT 32768 at 10 Hz below 150 Hz, with a complex crossfade up to 400 Hz. Unavailable when the main FFT is already 32768. |
| Measure 5 s Measure | Measurement mode (e.g. "Measure 5 s") |
| Sync Sync | Idle / Sync |
| Auto Idle Auto Idle | Only visible while idle |
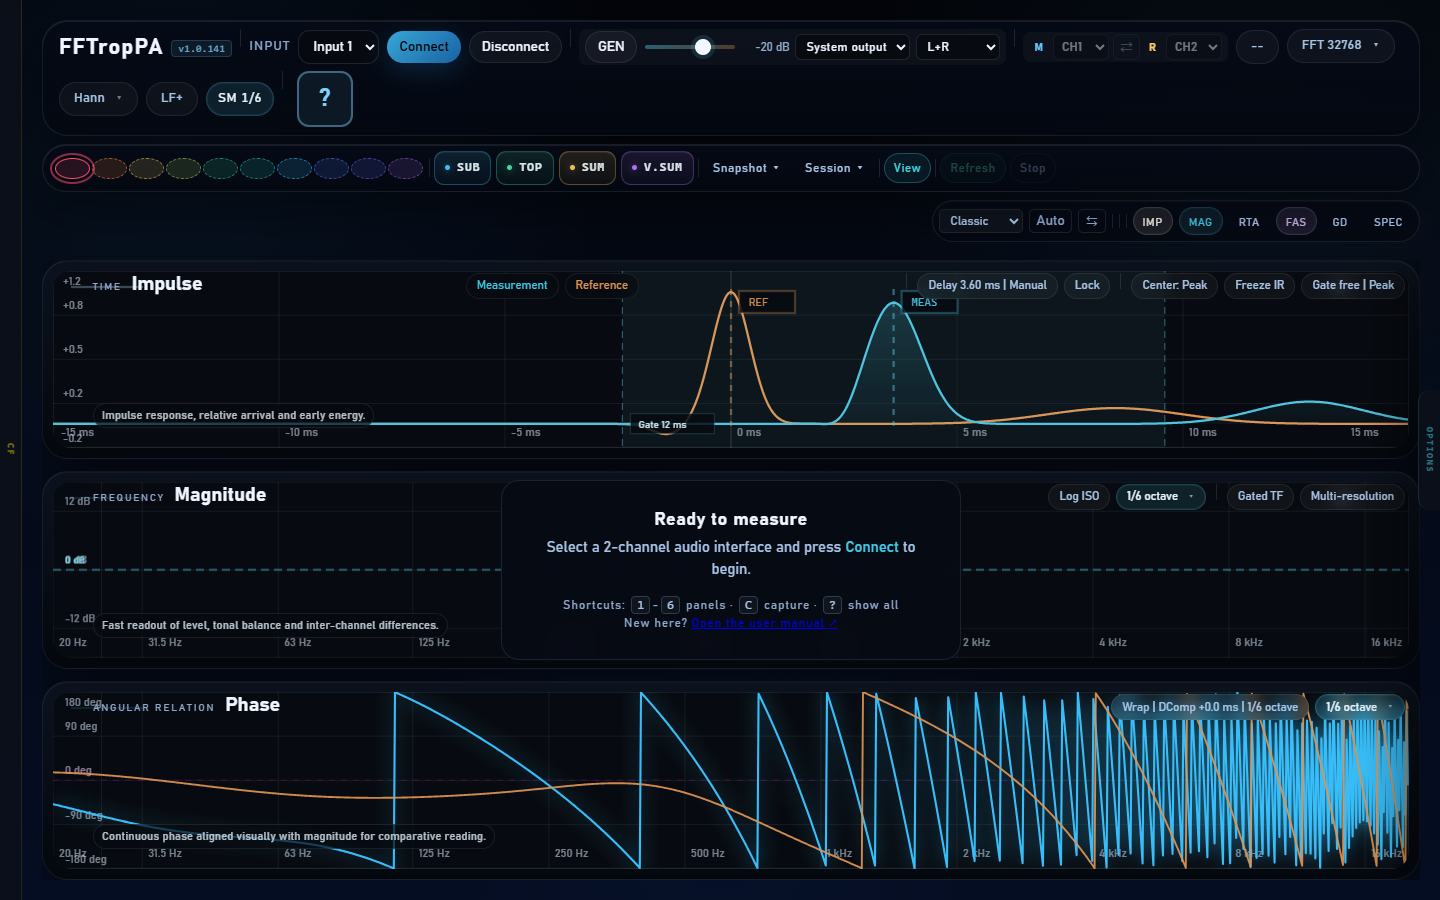
FFT chip.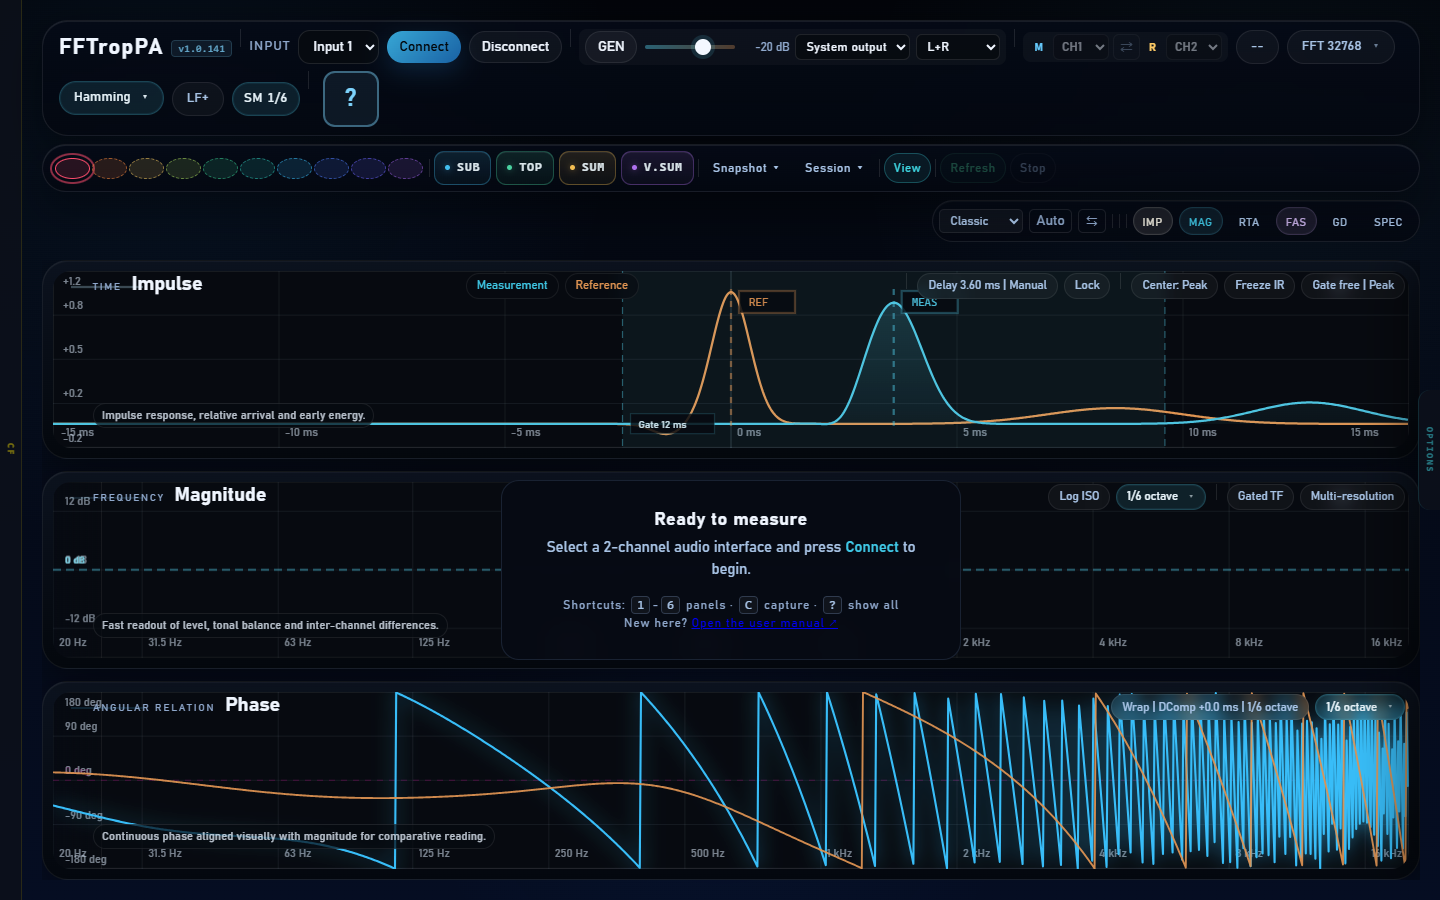
Window chip.3.6 Quick presets and view presets
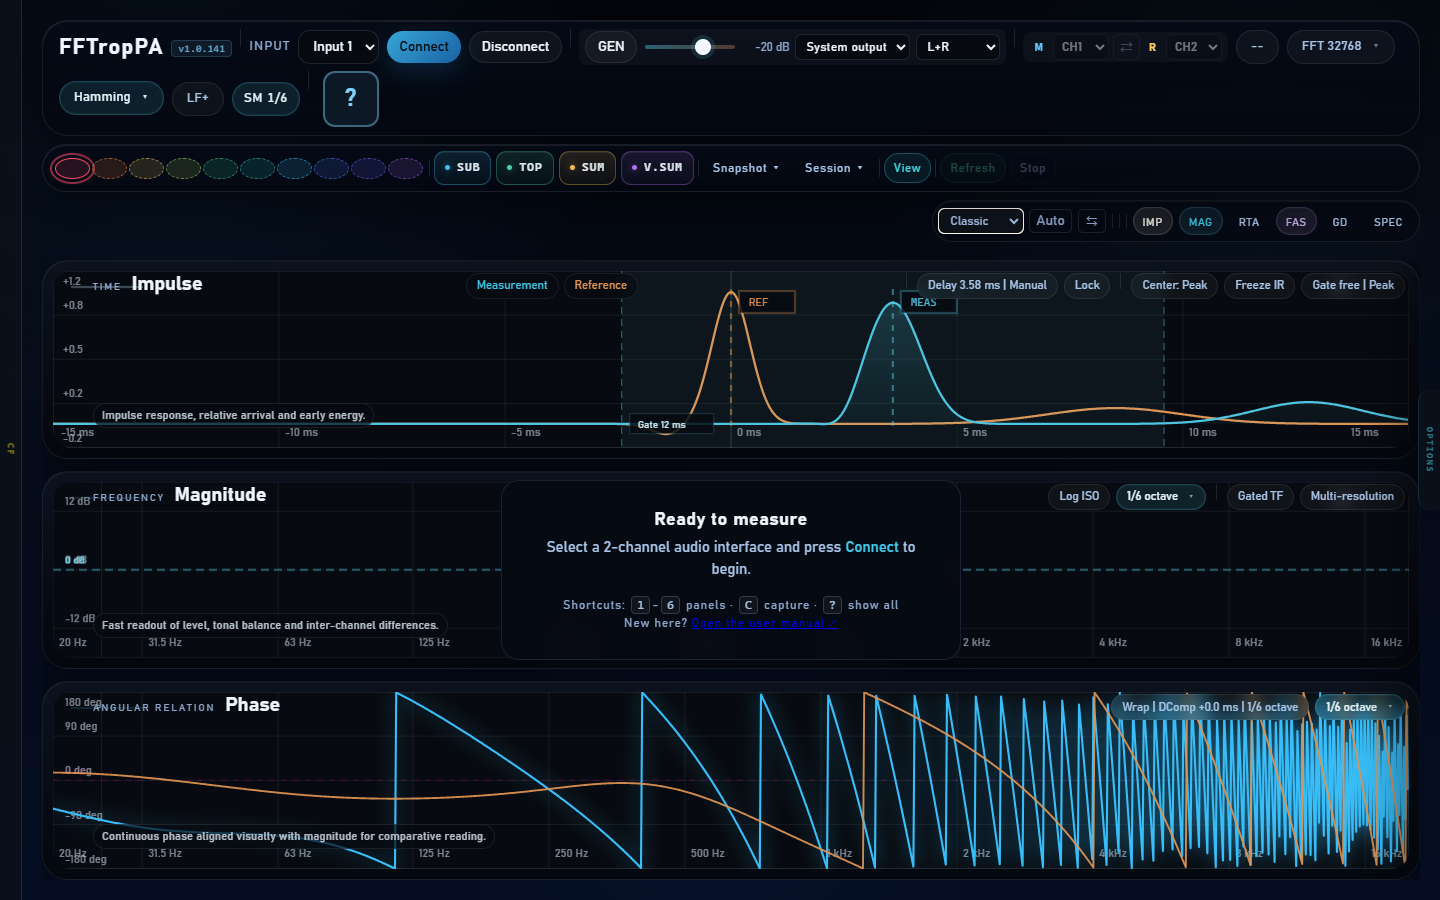
Two compact selectors: the Quick preset selector applies global presets (Default, Full TF, RTA Only, Phase + Magnitude + customs); the View preset selector applies active-panel presets (Classic, TF Full, Spectro, RTA, All, Custom).
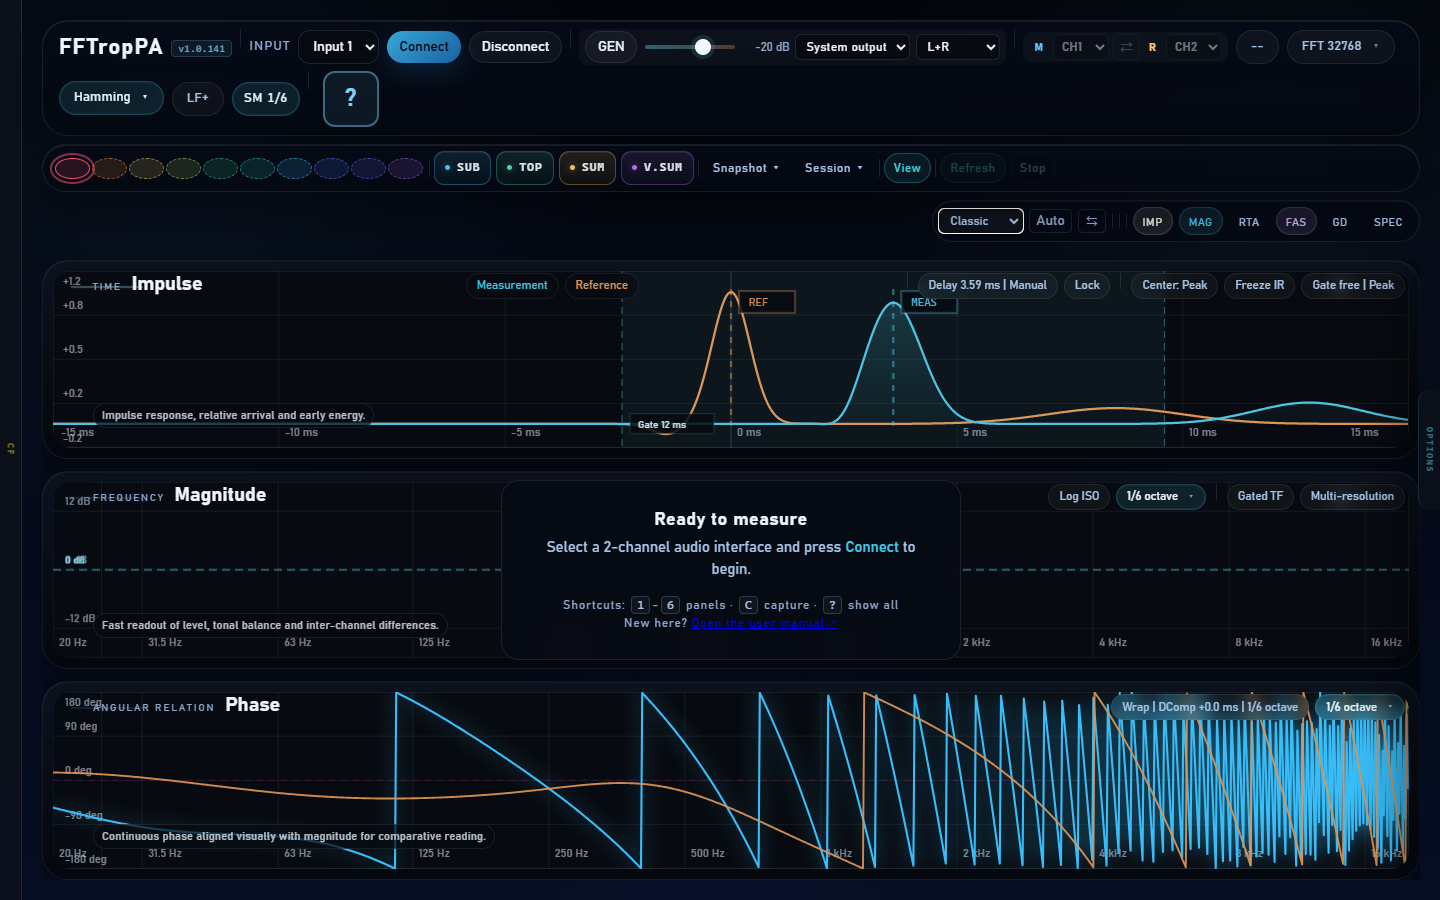
Crest Factor Tower
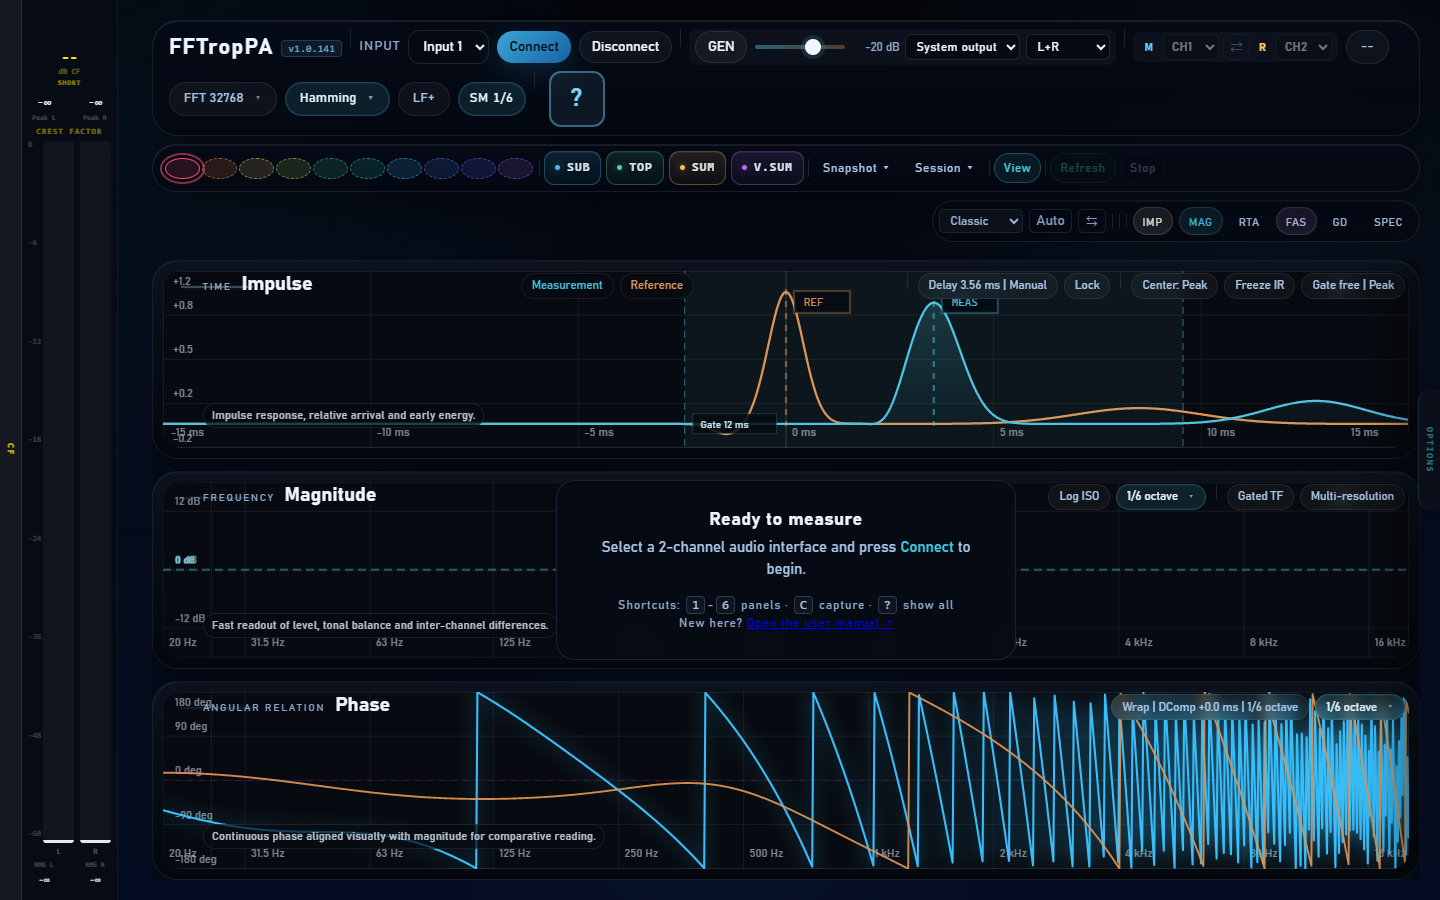
Left-side panel with two L/R level meters and the crest factor readout. Modes: SHORT / INT / LONG (calculation window). Each meter shows an RMS fill and a peak tick; numeric readouts sit above and below.
-∞.Options Tower
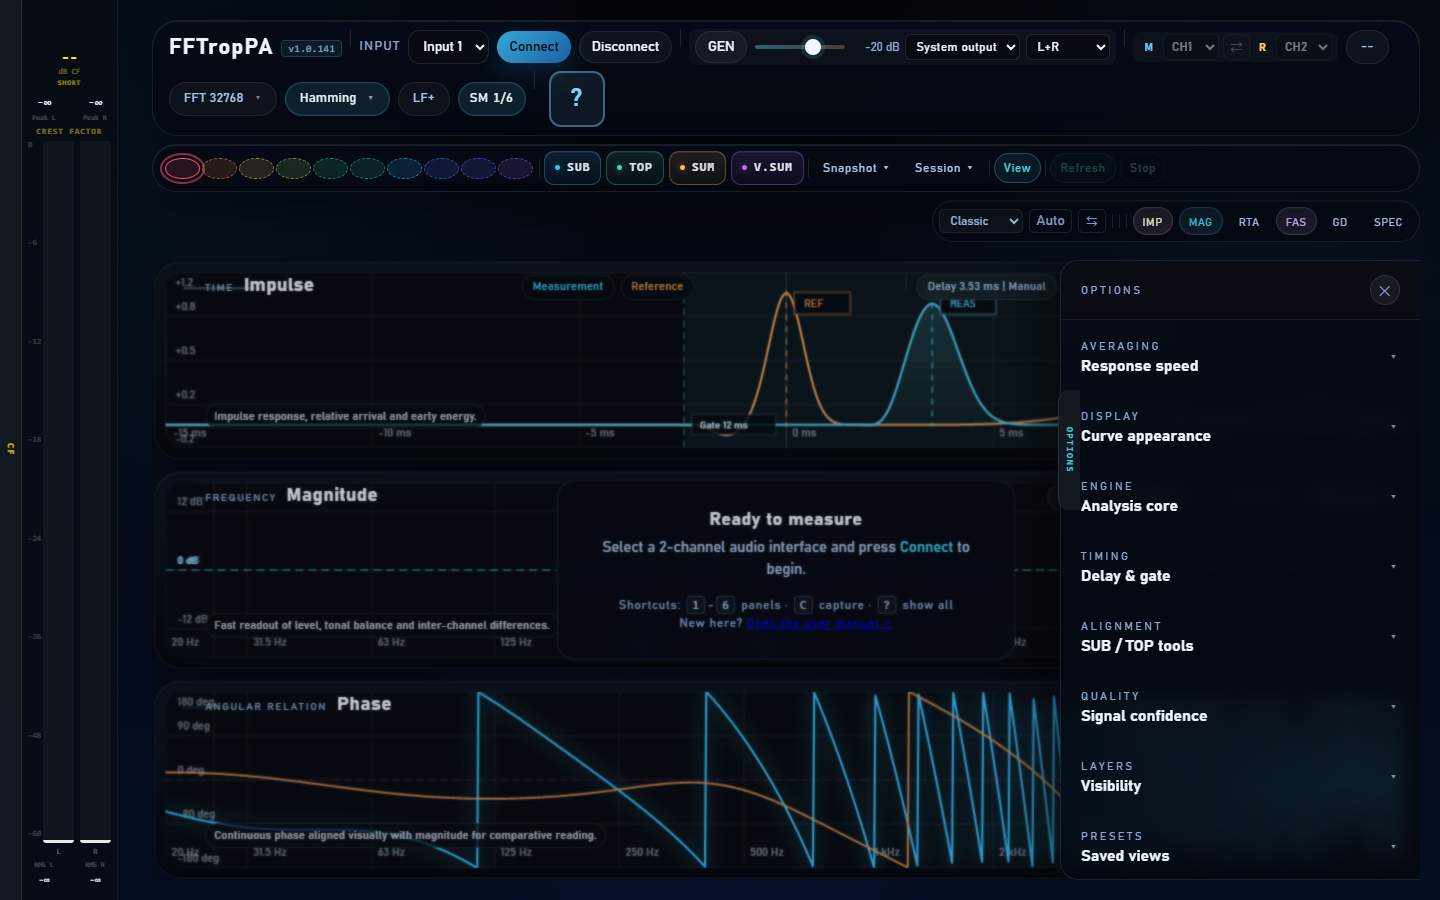
Right-side vertical tab that opens the Control Rail — the detailed parameter panel covered in chapter 15.
Empty state and onboarding
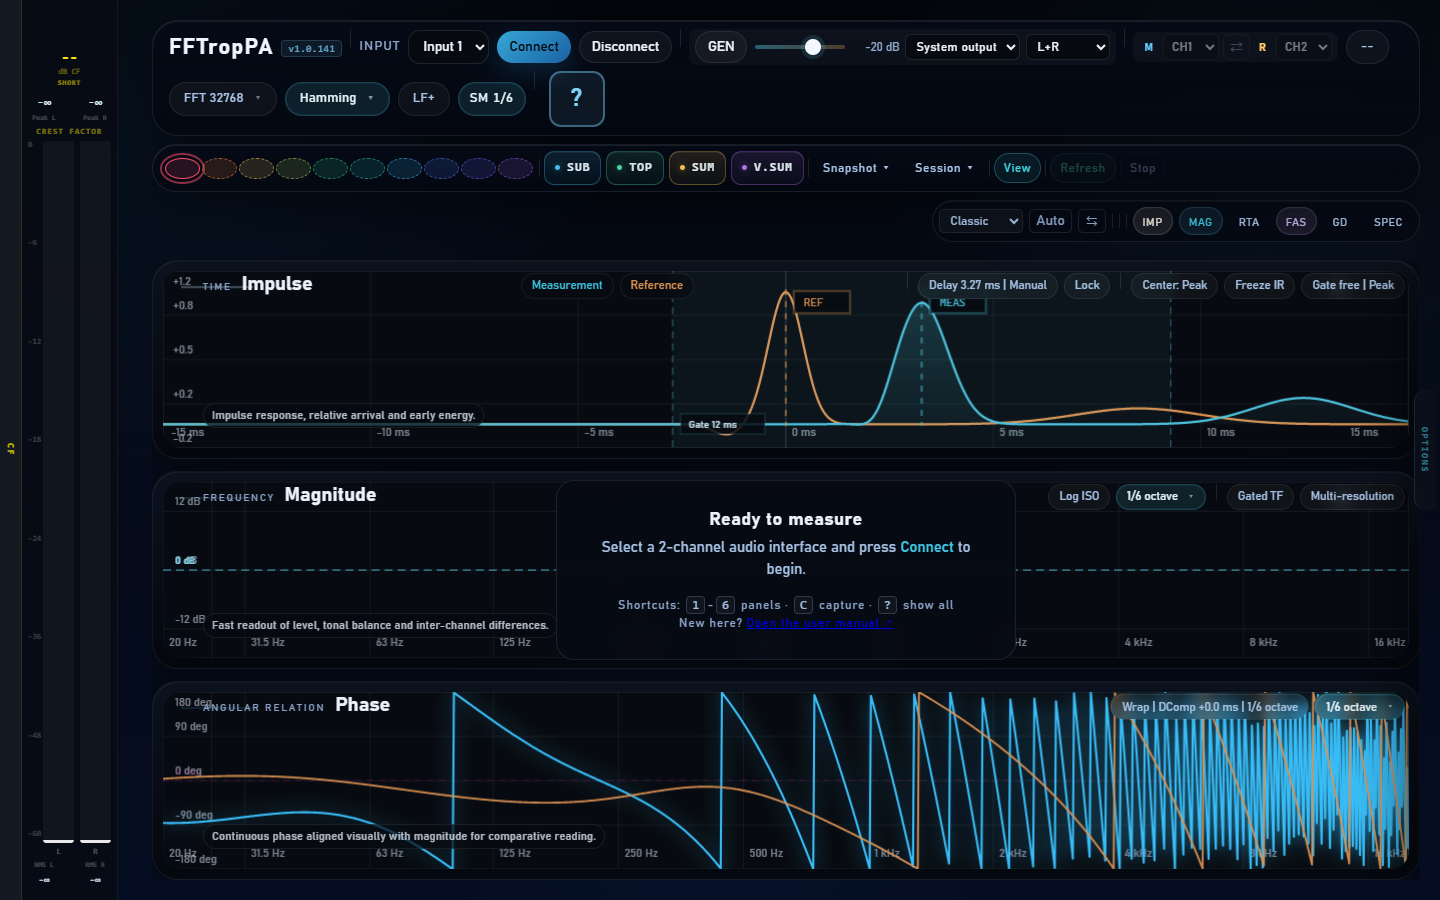
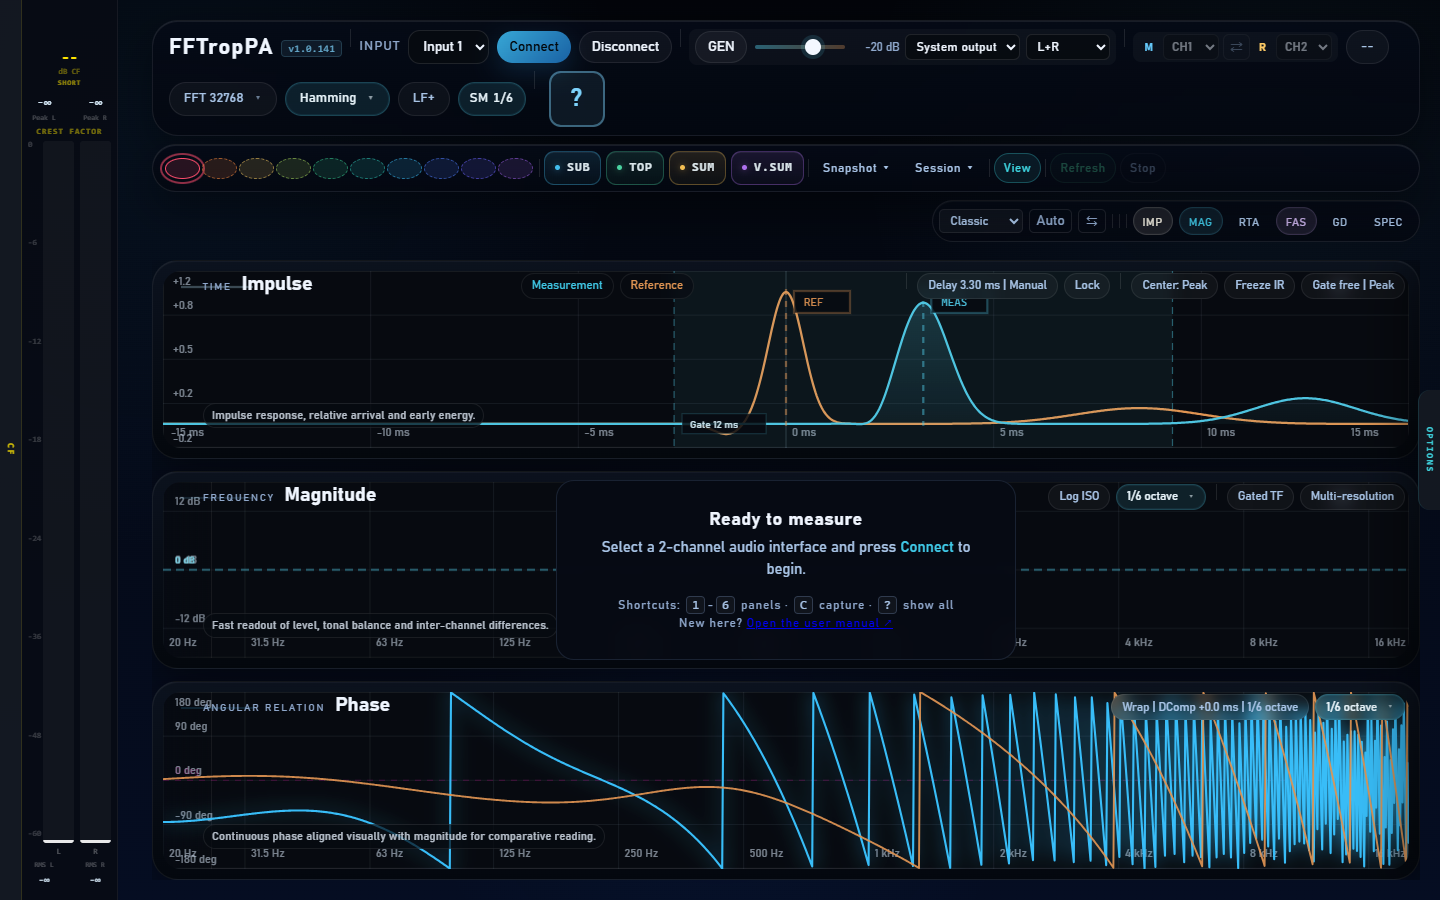
When no connection is active, an overlay covers the graph stage with the message "Ready to measure" and a hint about the basic shortcuts.
Canvas Inspector (global hover)
Hovering over any frequency panel (Magnitude, Phase, Group Delay) shows a readout of the value under the cursor:
- Hz — frequency under the cursor
- dB — magnitude at that frequency
- φ — phase at that frequency
When a selected snapshot is visible, the same readout adds Live, the snapshot value (SUB/TOP/SUM or slot number), and Δ at the cursor frequency. This changes only the reading context; it never modifies the stored capture.
Shared canvas navigation
- Wheel over content — smooth horizontal zoom anchored at the cursor.
- Drag over content — horizontal pan.
- Wheel or drag over the left axis — vertical zoom or pan.
- Double-click — reset the corresponding axis.
Magnitude, Phase, Group Delay and RTA share one frequency range. A thin context line appears at the bottom only while zoomed. Snapshots follow this range without changing their stored data.
Values appear only while a signal is active.
Impulse panel
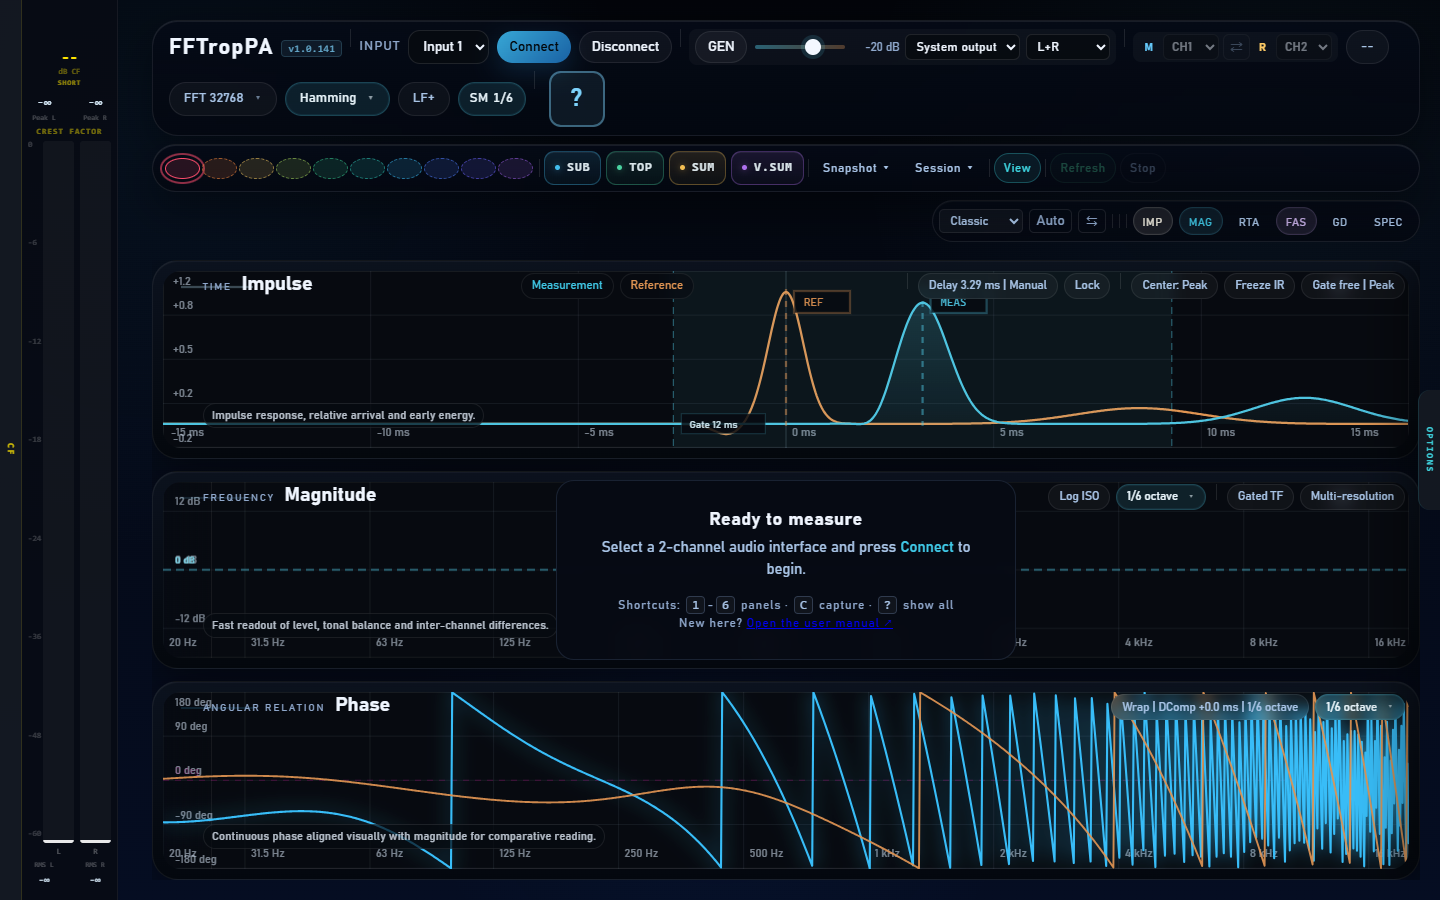
Domain: time. Shortcut: 1. Shows the measurement and reference impulse responses overlaid, with the gate window visualized as a translucent band.
The wheel zooms time at the cursor and dragging pans the view. The left axis controls amplitude. A fixed gate can be moved by dragging its body or resized from either edge. Double-click resets time or amplitude according to the pointer zone.
| Chip | Function |
|---|---|
| Gate 20 ms | 3.4 m | Shift +0.0 Window meta | Readout: gate width + equivalent distance + shift |
| Δ 2.3 ms Auto Delta delay | Current delay + mode (Auto / Manual) |
| Lock Lock delay | L — freezes the delay |
| Peak Center mode | Peak / Onset / Energy |
| Hold IR Hold IR | H — freezes the IR |
| Gate ⊙ Gate center lock | G — pins the gate position |
Lock freezes the current sub-sample impulse reference (Peak or Arrival). It does not automatically flatten a phase slope: converter, crossover and loudspeaker group delay remains visible as part of the measured system. Frequency-band phase fitting is reserved for the deliberate Alignment Tools workflow.
Magnitude panel
Domain: frequency. Shortcut: 2.
| Chip | Function |
|---|---|
| Log Frequency scale | F — Log / Lin |
| 1/6 Octave res | 1/24 / 1/12 / 1/6 / 1/3 / 1/1 / Raw |
| Gated TF Gated TF | TF using the Impulse panel time window |
| MTW Multi-resolution | Per-band time windows; unlike LF+, it does not change FFT bin spacing |
| 2× MTW preset | 2× / 3× / 4× |
RTA panel
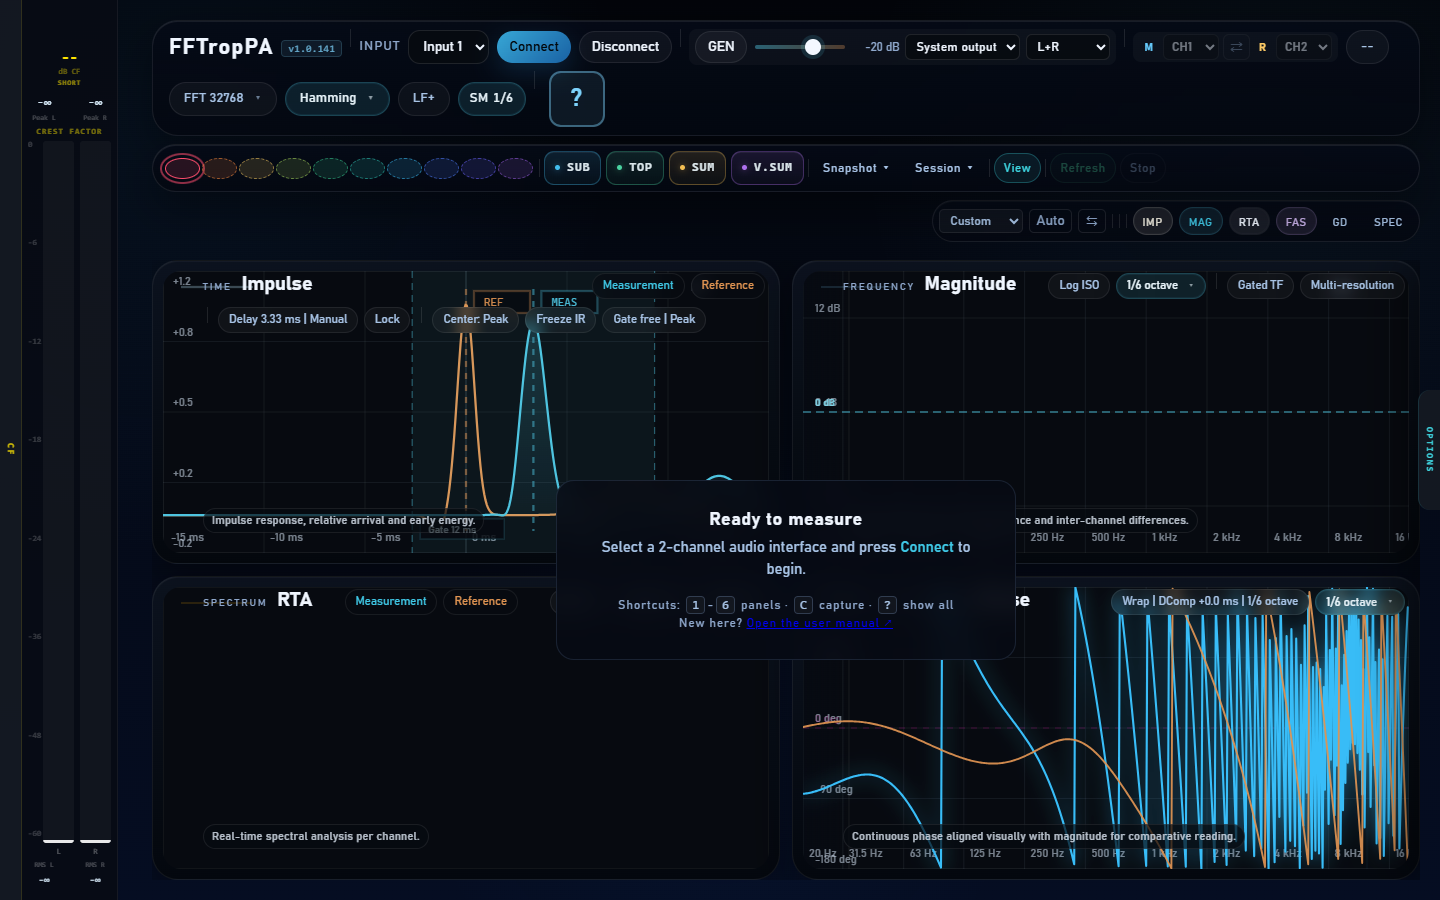
Domain: real-time spectrum. Shortcut: 3. Shows instantaneous spectrum of M and R at the same time.
RTA supports the same shared frequency zoom and pan as Magnitude, Phase and Group Delay. Its left axis controls only the local dB scale.
| Chip | Function |
|---|---|
| M front Front | Toggle which curve is on top (M or R) |
| Bars 1/12 Style | Lines / Bars 1/3 / 1/6 / 1/12 / Psy / FFT |
| Peak Peak | Peak hold tick |
Phase panel
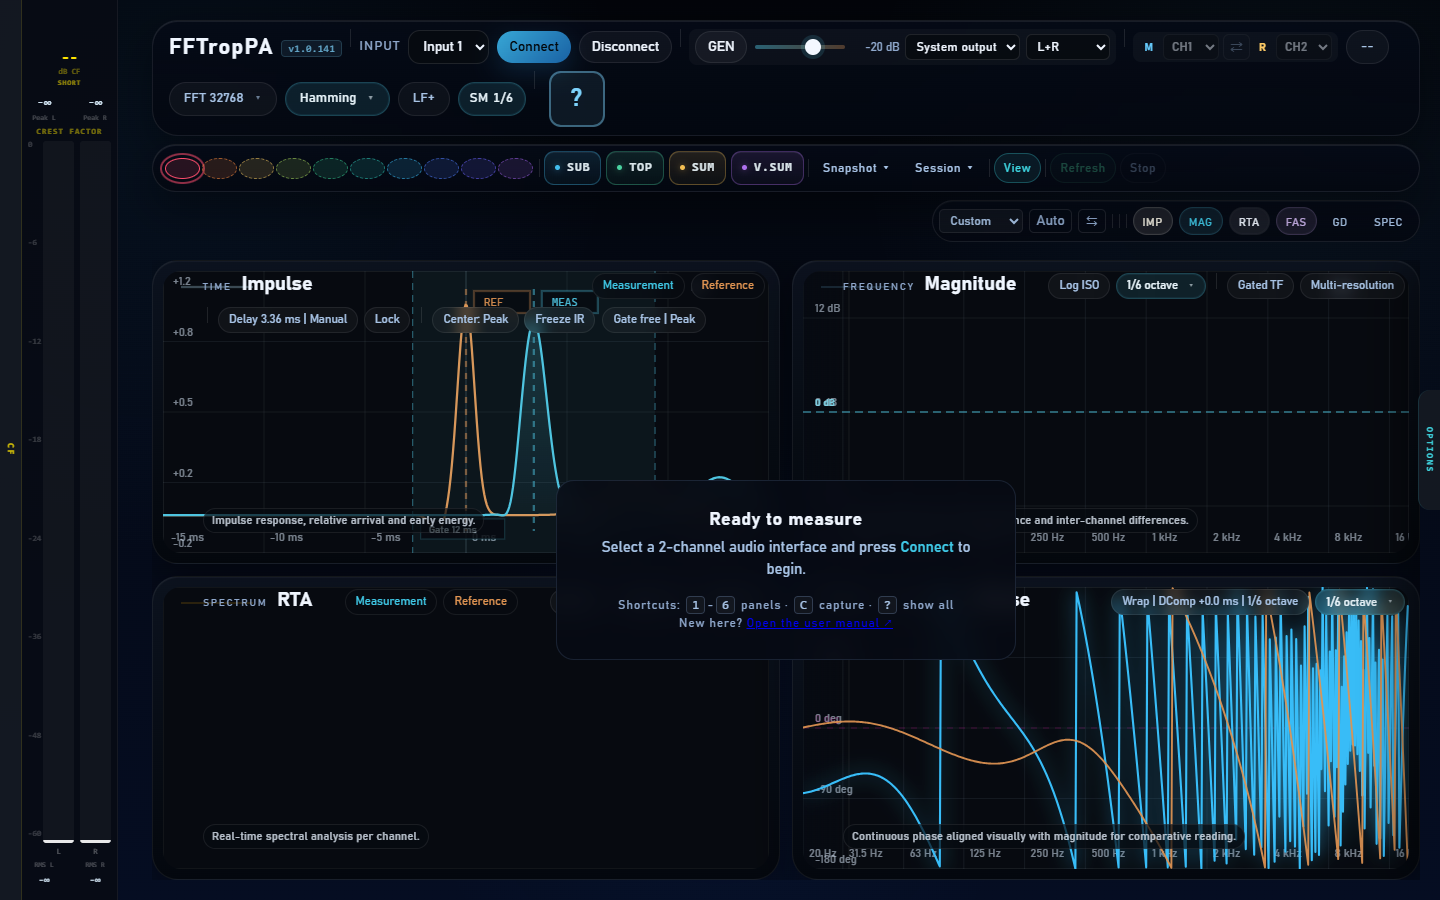
Domain: frequency (phase). Shortcut: 4. Continuous phase (wrap/unwrap) visually aligned with magnitude.
| Chip | Function |
|---|---|
| Wrap | DComp | 1/6 Phase mode | Wrap / Unwrap + the applied DComp + the actual Phase smoothing resolution. RAW uses circular bin projection. |
| 1/6 Smoothing | Phase-dedicated smoothing (independent from magnitude) |
Group Delay panel
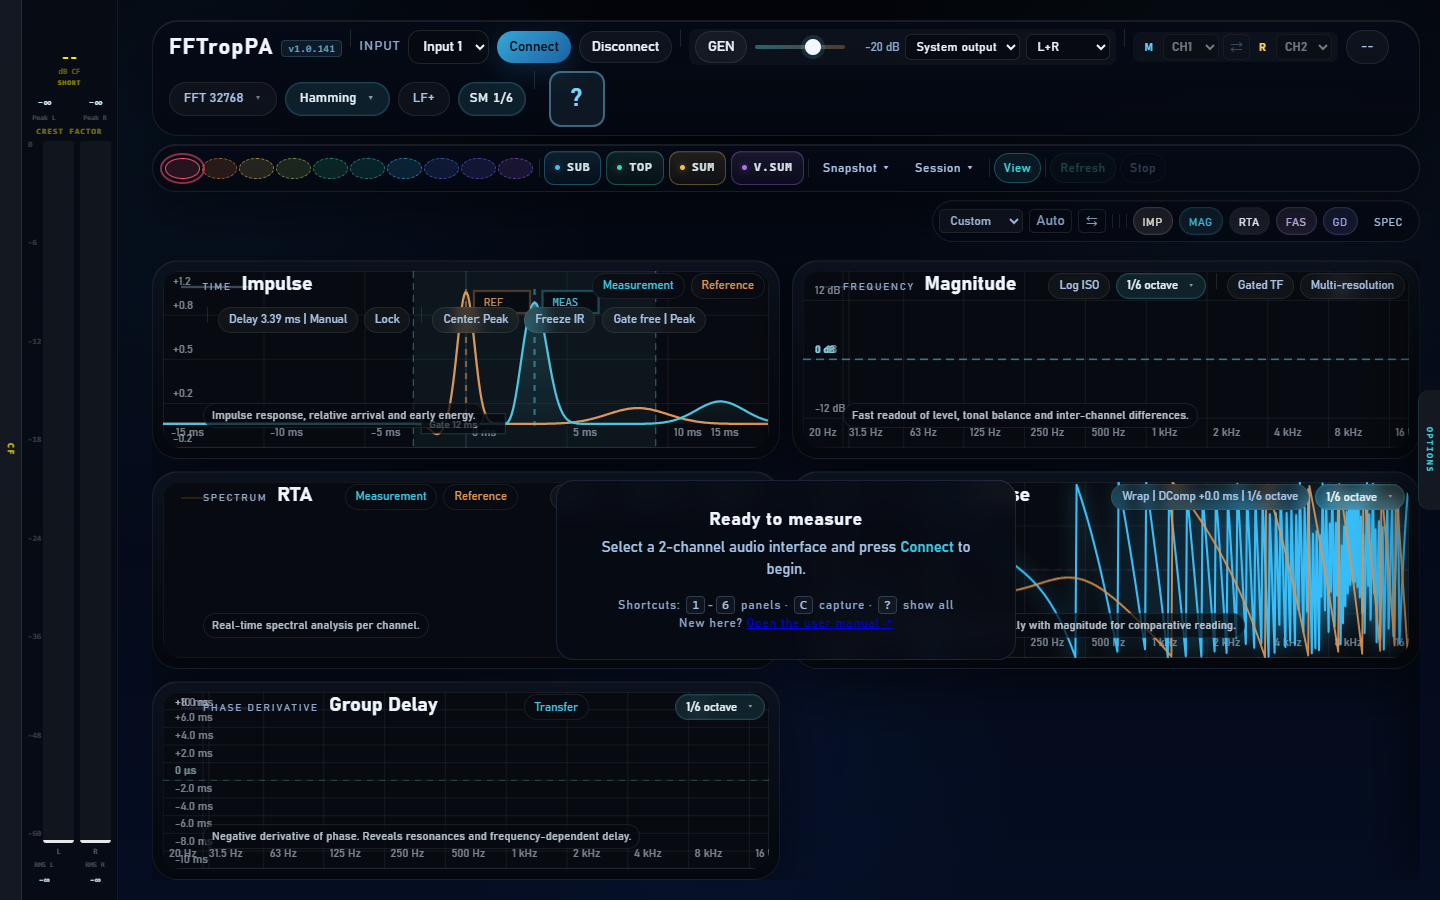
Domain: frequency (-dφ/df). Shortcut:
5. Negative derivative of the phase. Useful for spotting
resonances and frequency-dependent delay. No configurable chips
(it is derived from the phase).
The X axis follows the shared frequency range. Wheel input over the left axis uses a GD-specific accelerated scale: a physical wheel step roughly halves the visible range, while trackpad gestures remain continuous. This makes both the initial ±10 ms view and ±10 µs residual inspection reachable. Double-click the left axis to restore ±10 ms.
CWT Scalogram panel
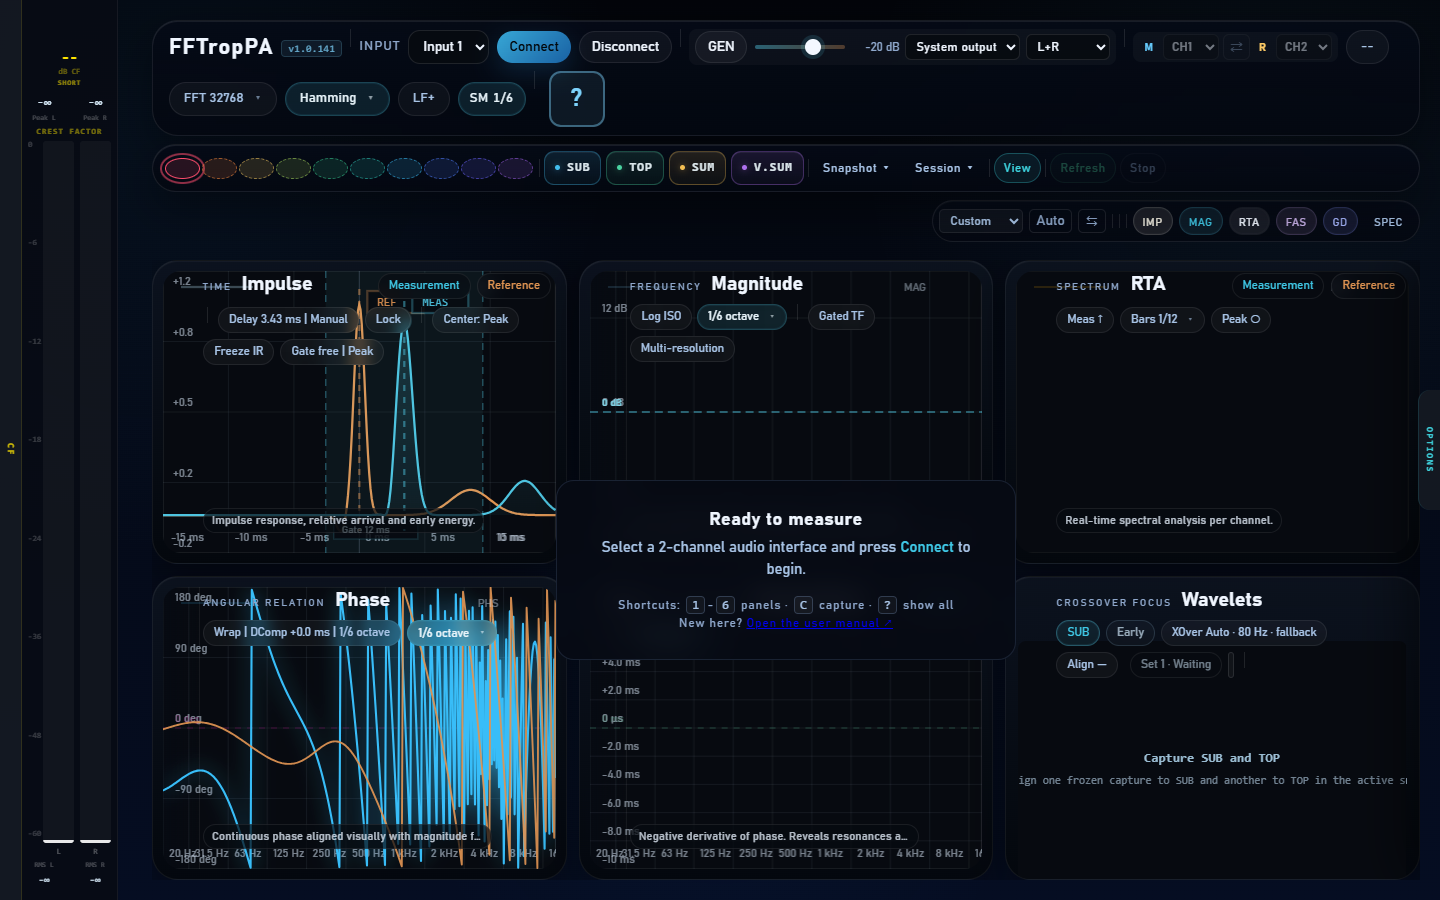
Domain: time × frequency (wavelet). Shortcut: ⇧7. Marked as experimental. Not included in the Spectro or All view presets — toggle it explicitly with ⇧7.
Analysis modes
- Single Signal — analyzes a single channel.
- Ref / Meas — compares R vs M (L = Meas, R = Ref in stereo).
- Alignment — subwoofer / crossover alignment mode.
Header and advanced chips
| Chip | Values |
|---|---|
| Review View mode | Review / Advanced |
| Mono Channel | Mono / Stereo / L / R |
| Full Range | Full / XOver 40-300 / LF 20-200 / System |
| Morlet Q=6 Wavelet | Morlet Q=3 / Q=6 / Q=12 |
| Global Norm | Global / Per-frame |
| Magma Colormap | Magma / Viridis / Inferno / Plasma |
| 80 dB dB range | 40 / 60 / 80 / 100 dB |
| Guide Ridge | Off / Subtle / Guide / Diagnostic |
| Probe Probe | Pin (t, f) with a click |
Spectrogram panel
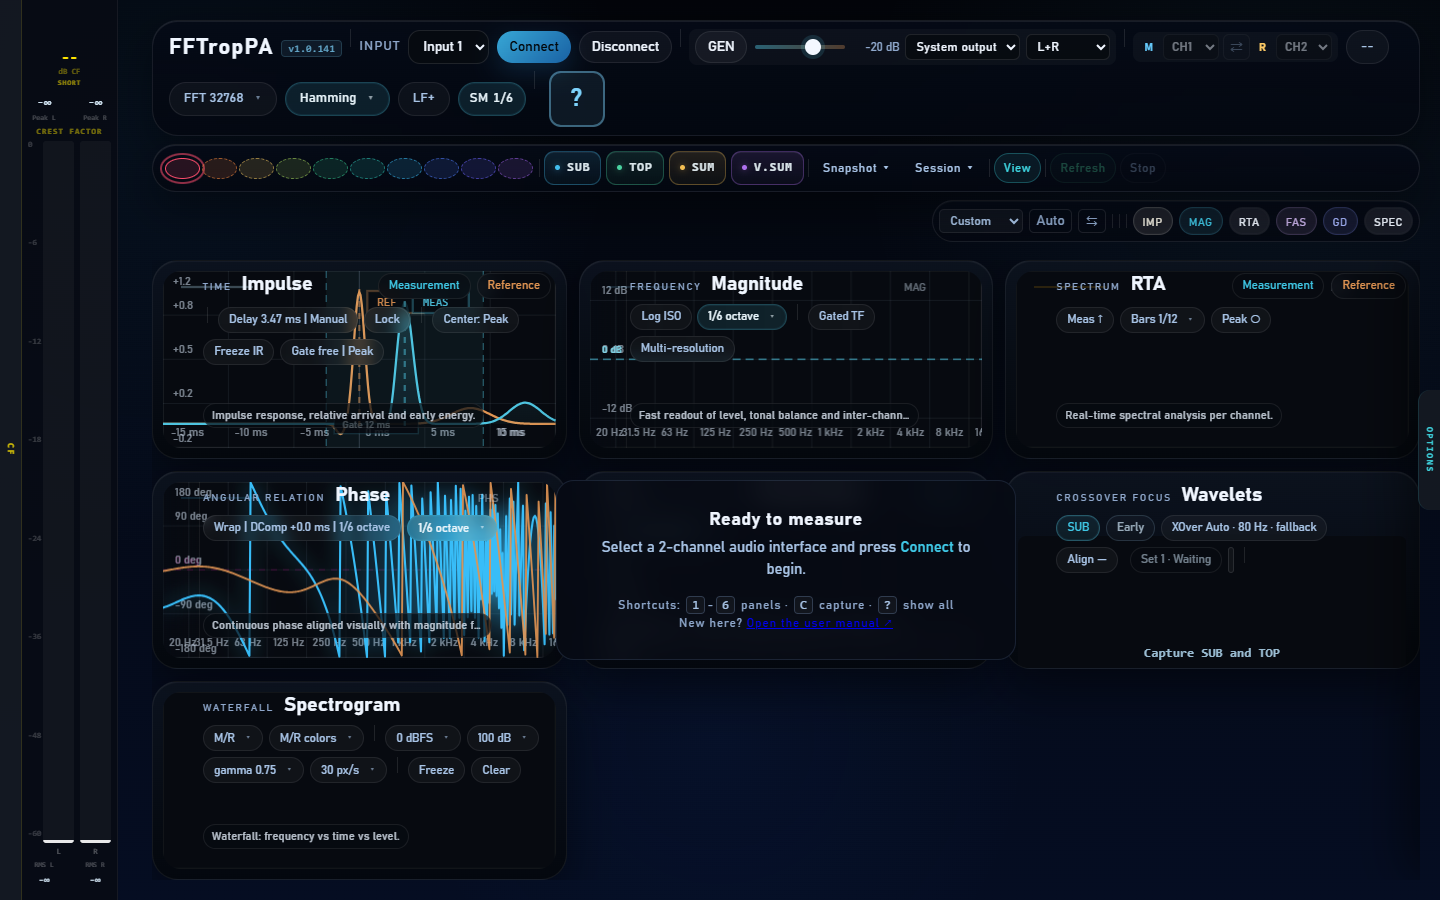
Domain: spectral waterfall. Shortcut: 6. Each row uses the instantaneous, dBFS-calibrated analysis spectrum and is independent from RTA temporal smoothing.
| Chip | Values |
|---|---|
| M/R Source | M-R balance / Measurement / Reference. M-R uses RTA colors: cyan for Measurement and orange for Reference. |
| Source colors Color | Source colors / Ocean / Magma / Viridis / Neon / Gray. Optional palettes are available for individual M or R views. |
| 0 dBFS Ceiling | 0 / -6 / -12 / -18 / -24 / -30 dBFS |
| 100 dB Range | 60 / 70 / 80 / 90 / 100 / 110 / 120 dB |
| gamma 0.75 Gamma | 0.45 / 0.60 / 0.75 / 0.90 / 1.10 / 1.40 / 1.80 |
| 30 px/s Speed | 20 / 30 / 50 / 100 / 200 px/s |
| Freeze Freeze | Freezes image and time reference; Resume continues from the present |
| Clear Clear | Clears the waterfall history |
Control Rail — advanced options
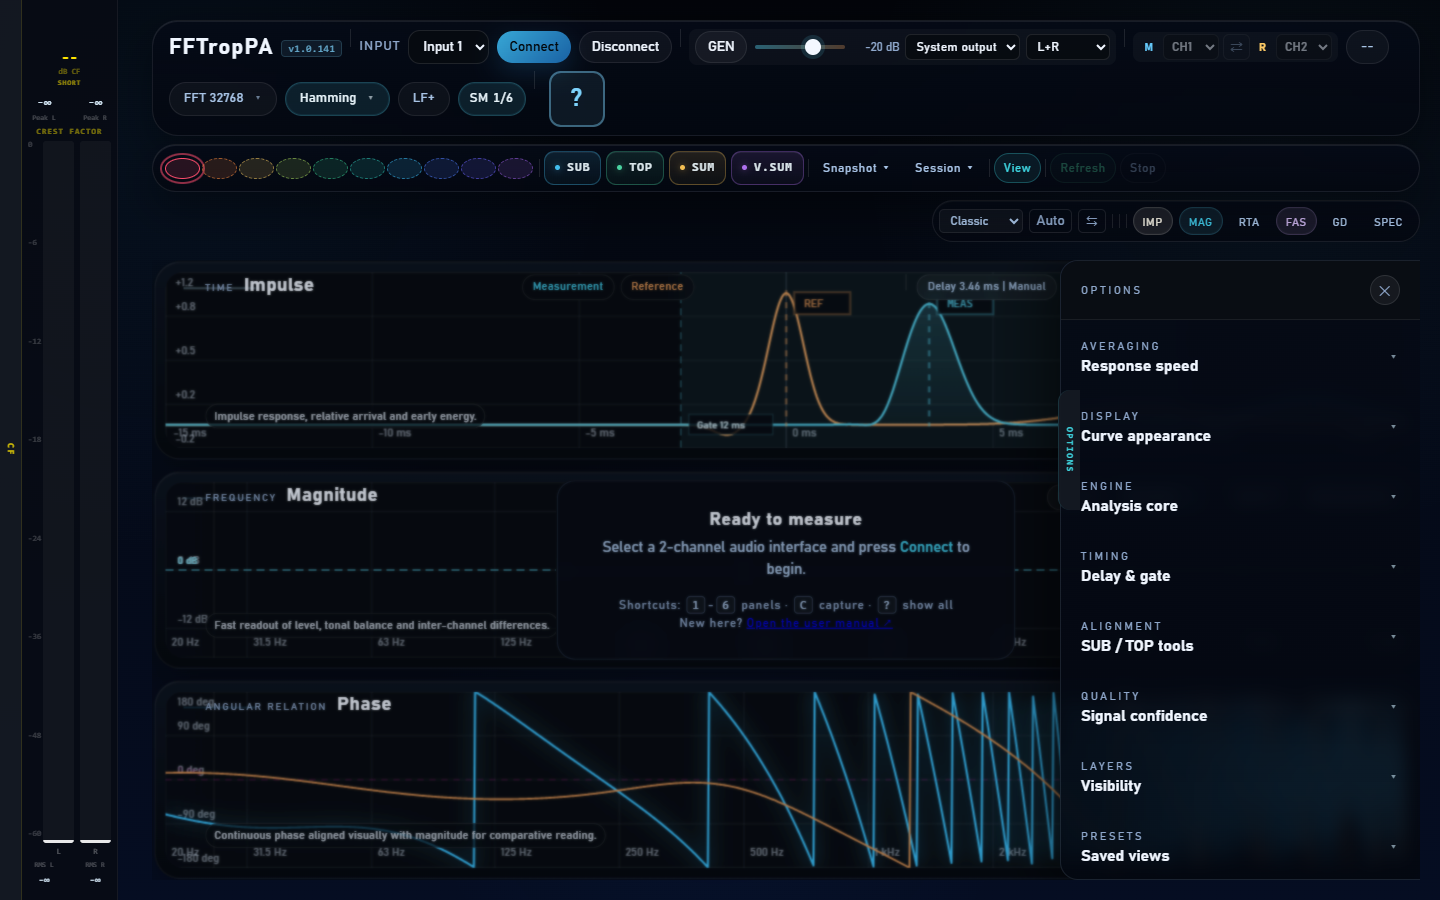
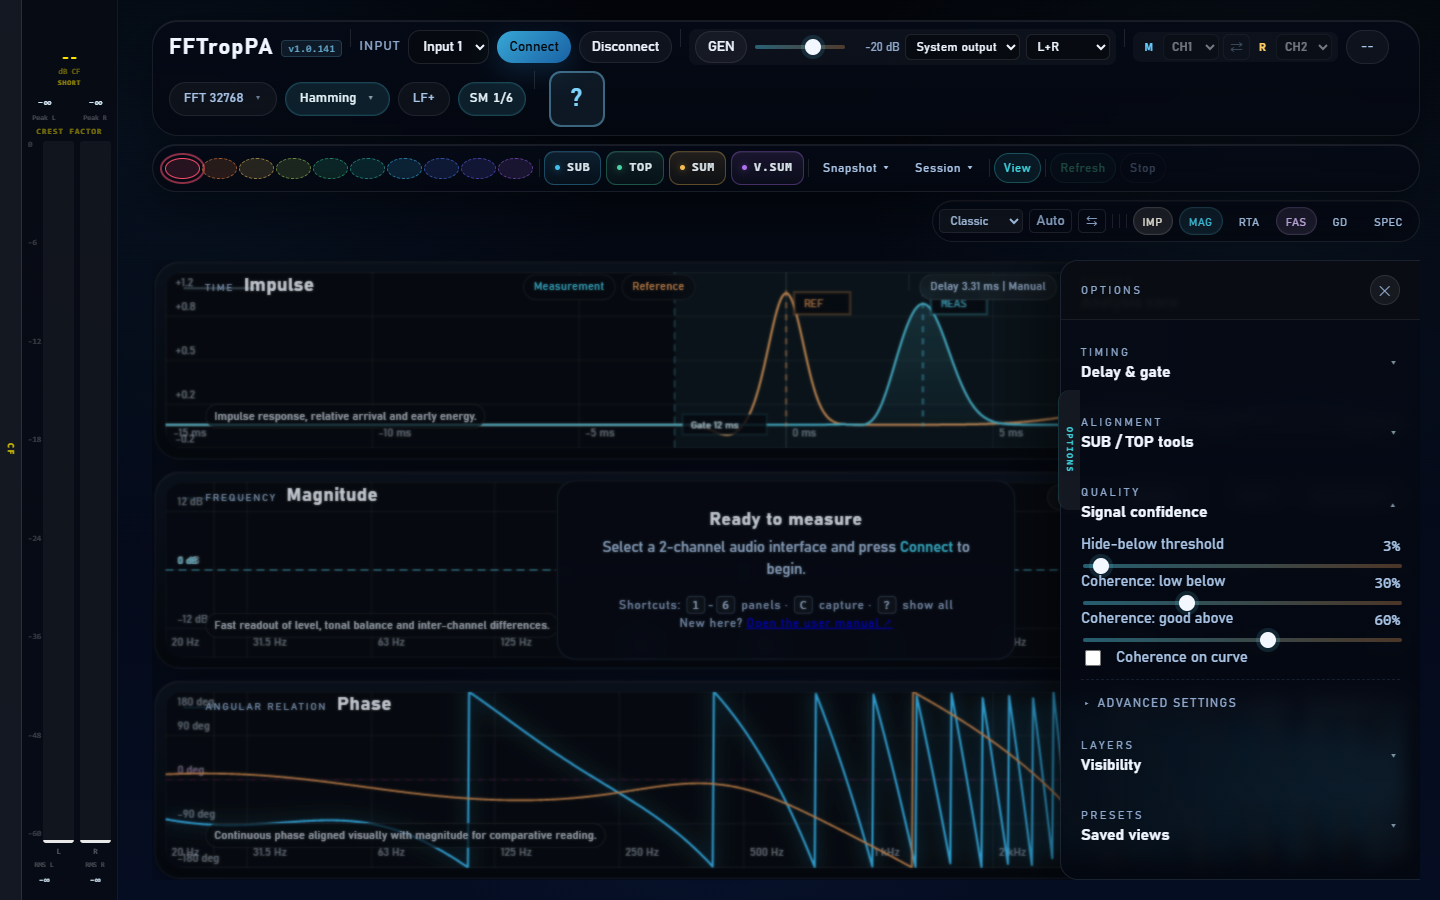
Slide-out panel on the right that opens from the Options Tower or from a click on any chip without an immediate action. It is organized into eight collapsible sections, grouped by domain: Averaging, Display, Engine, Timing, Alignment, Quality (with an Advanced block at its tail), Layers, and Presets. Each section header (eyebrow + title) is a clickable summary with a chevron. All sections start collapsed; the open/closed state of each one is remembered across sessions.
15.2 Averaging — Response speed
RTA averaging (20 ms – 3 s, default 150 ms) and Transfer averaging (20 ms – 2 s, default 1.50 s).
15.3 Display — Curve appearance
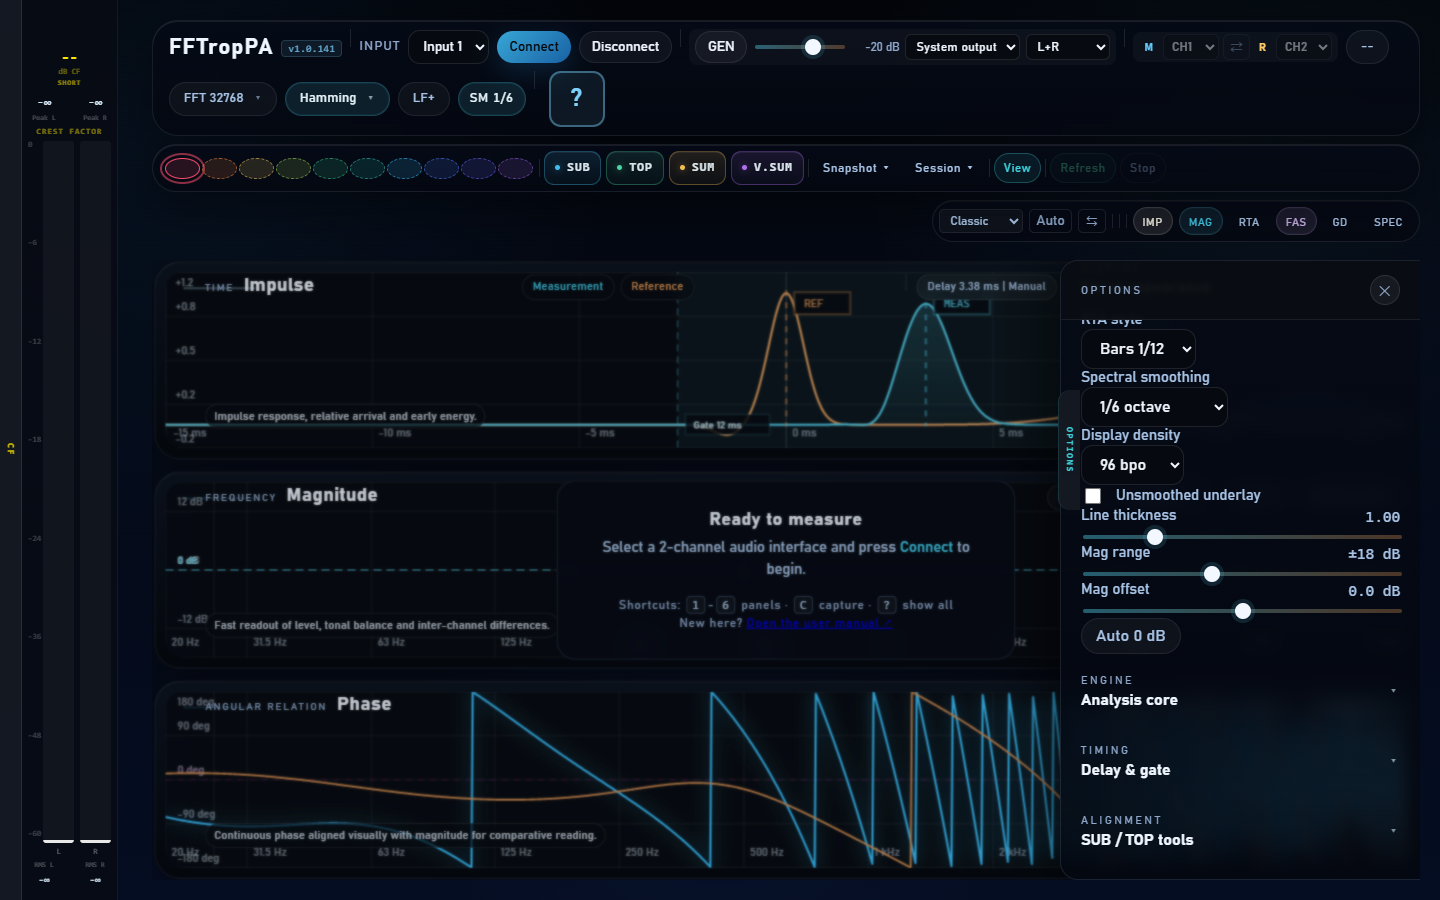
RTA style, spectral smoothing, display density (48/96/192 bpo), unsmoothed underlay, line thickness, mag range/offset with Auto 0 dB.
15.4 Engine — Analysis core
FFT size, LF/HF transition frequency (default 80 Hz) and Max LF stability (default 4×).
15.5 Timing — Delay & gate
Impulse gate width (2–100 ms), auto delay compensation (D) and manual delay trim.
15.6 Alignment — SUB / TOP tools
Three first-level dropdowns: Frozen IR comparison
(one-shot compare against the live impulse), LF
Alignment (band select + Detect / Apply), and
Predict SUB + TOP (virtual sum — enable, independent
virtual delay/gain/polarity for SUB and TOP; kept in sync with the
V.SUM quick button of the snapshot bar).
15.7 Quality — Signal confidence
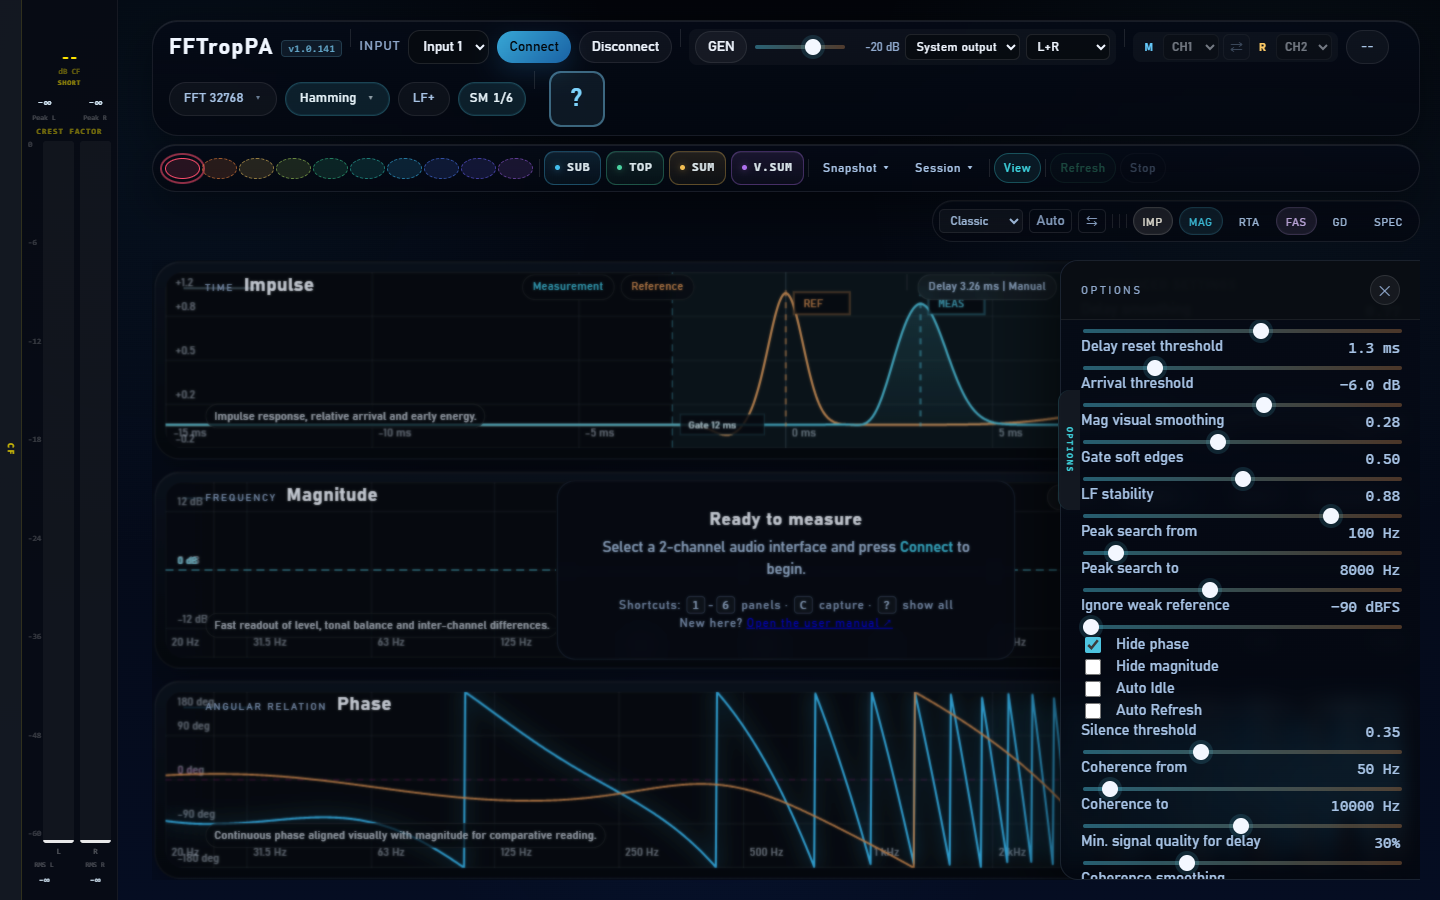
Hide-below threshold and coherence thresholds. The Advanced block at the end exposes delay smoothing, arrival threshold, gate Tukey alpha, LF stability, peak search band, weak-reference threshold, auto-idle, auto-refresh, coherence band.
15.8 Layers — Visibility
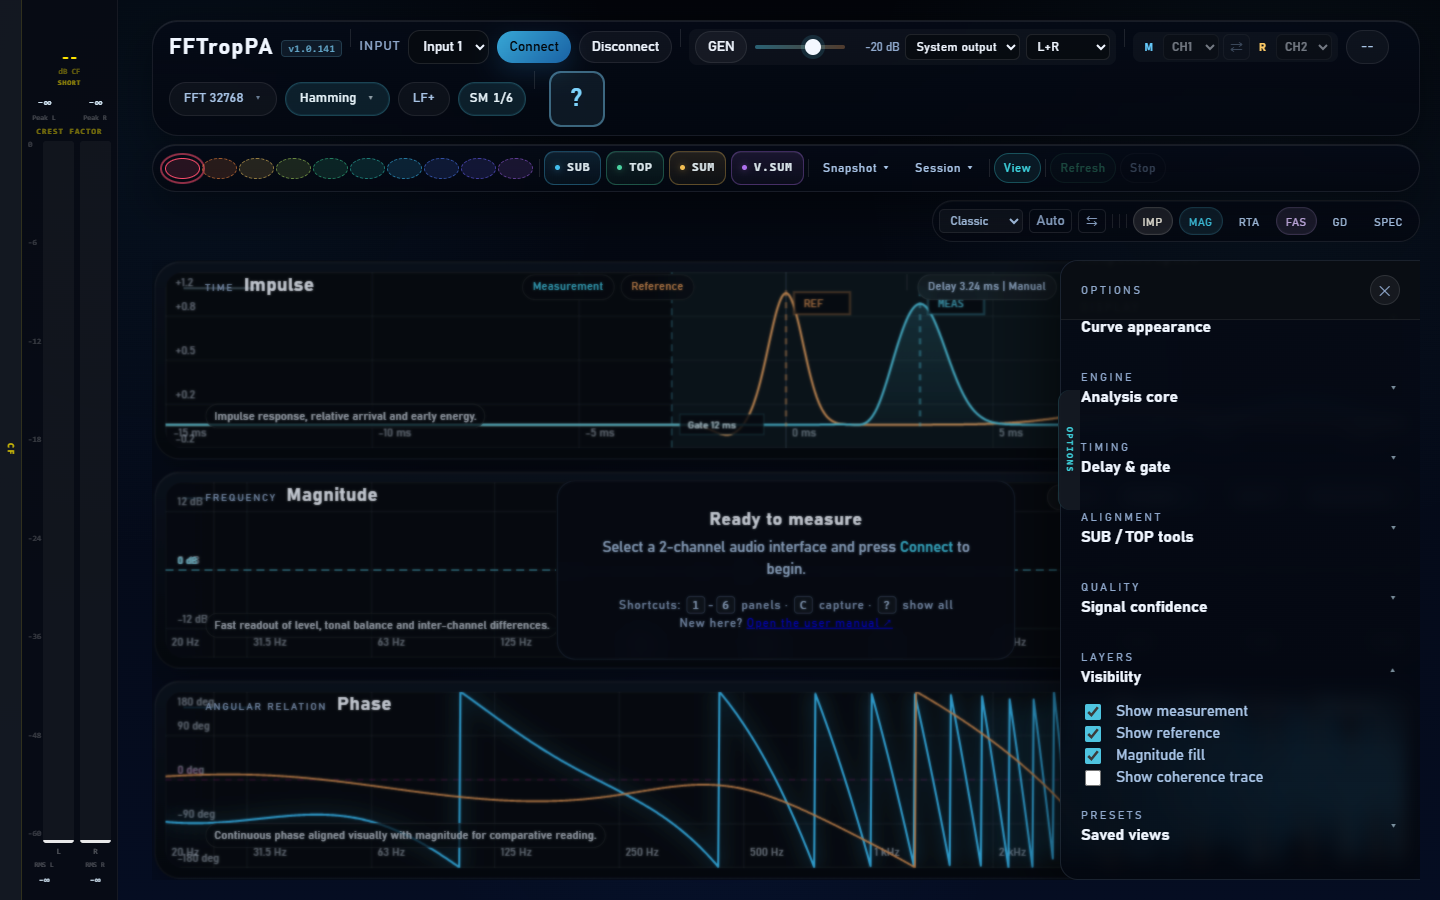
Four global toggles that affect every relevant panel:
- Show measurement
- Show reference
- Magnitude fill
- Show coherence
15.9 Presets — Saved views
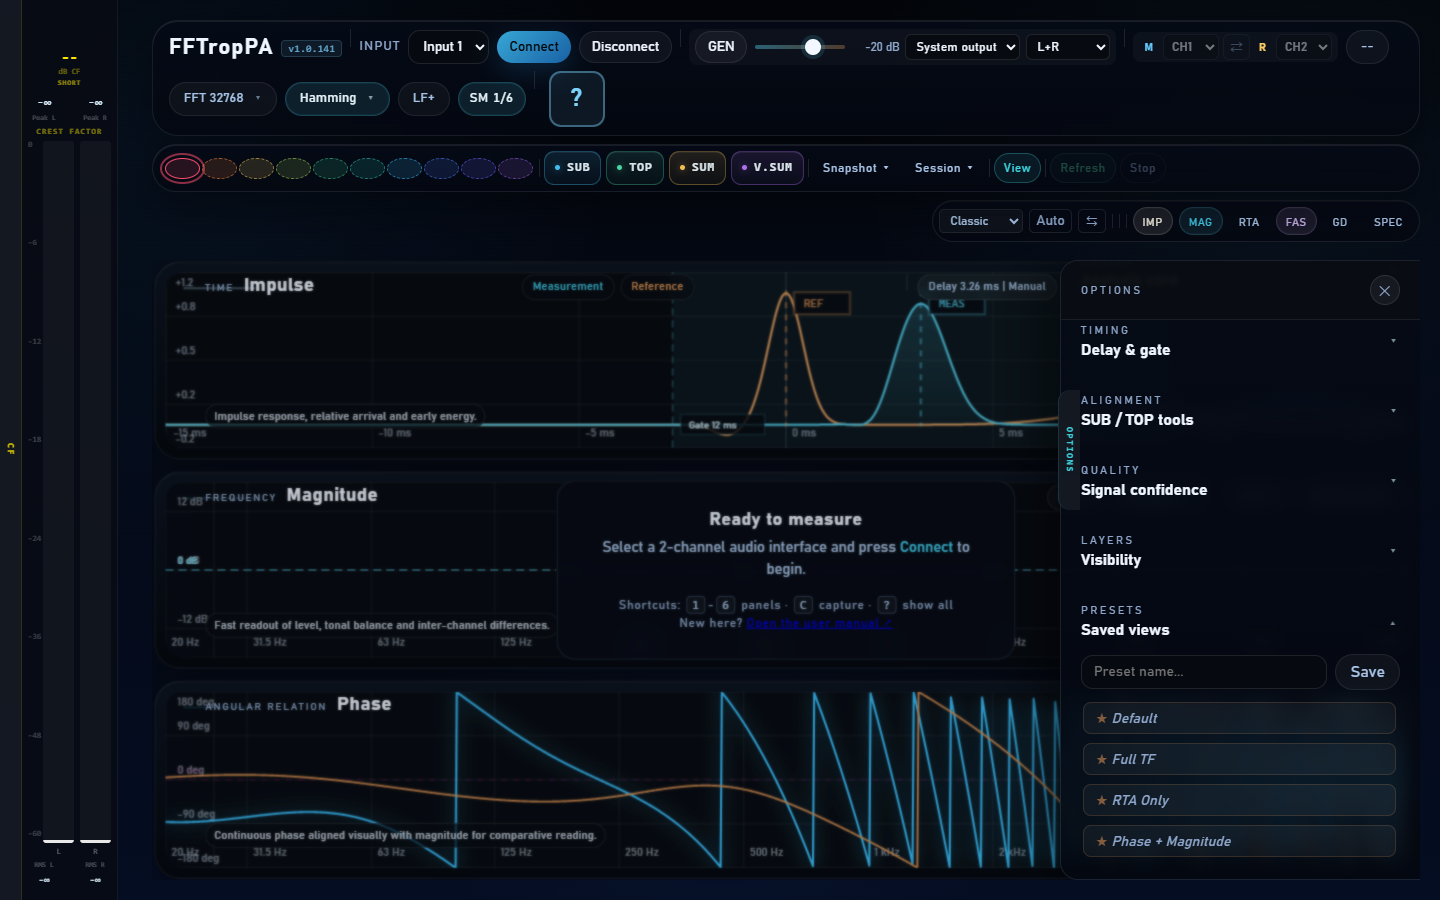
User presets. Name input, Save button, list that includes builtins (Default, Full TF, RTA Only, Phase + Magnitude) and customs saved by the user.
Snapshots and A/B comparison
Model
- 10 fixed slots, indexed 0-9, with a color assigned per slot.
- Each slot stores a snapshot of the TF state (magnitude, phase, coherence, IR, capture-time DSP parameters).
- Multiple captures stack; the next
Capturefills the first empty slot.
Interactions
- Left-click on a dot → toggle slot visibility.
- Right-click on a dot → contextual menu:
⏺ Replace,✕ Clear,↓ Export .txt. - C → capture.
- Shared zoom and pan change only the viewport. Stored curves are reprojected without changing or re-smoothing the capture.
- The canvas inspector reports Live / snapshot / Δ at the cursor frequency for a compact point comparison.
Each of the ten slots keeps a fixed color, so you can tell at a glance which curve on the graph belongs to which snapshot. The colors are shown on the dots in the snapshot bar.
Sessions — save / load
Save session
Save session → downloads a .json with
every DSP parameter, active panels, layout, current preset, visibility
toggles, and per-panel chip states.
Session + snaps
Session + snaps → same plus the 10 saved snapshots.
Load session
Load session → file picker. Restores the full configuration and loads snapshots if present.
Presets
Quick presets (builtins)
| Name | Description |
|---|---|
| Default | Sane initial state |
| Full TF | Impulse + Magnitude + Phase + Group Delay |
| RTA Only | RTA panel only |
| Phase + Magnitude | Mag + Phase with unwrap + 1/6 octave |
View presets (Shift+1..5)
| Shortcut | Label | Active panels |
|---|---|---|
| ⇧1 | Classic | impulse + magnitude + phase |
| ⇧2 | TF Full | impulse + magnitude + phase + groupdelay |
| ⇧3 | Spectro | magnitude + spectrogram |
| ⇧4 | RTA | rta + magnitude |
| ⇧5 | All | all panels except CWT (CWT only via ⇧7) |
Special modes
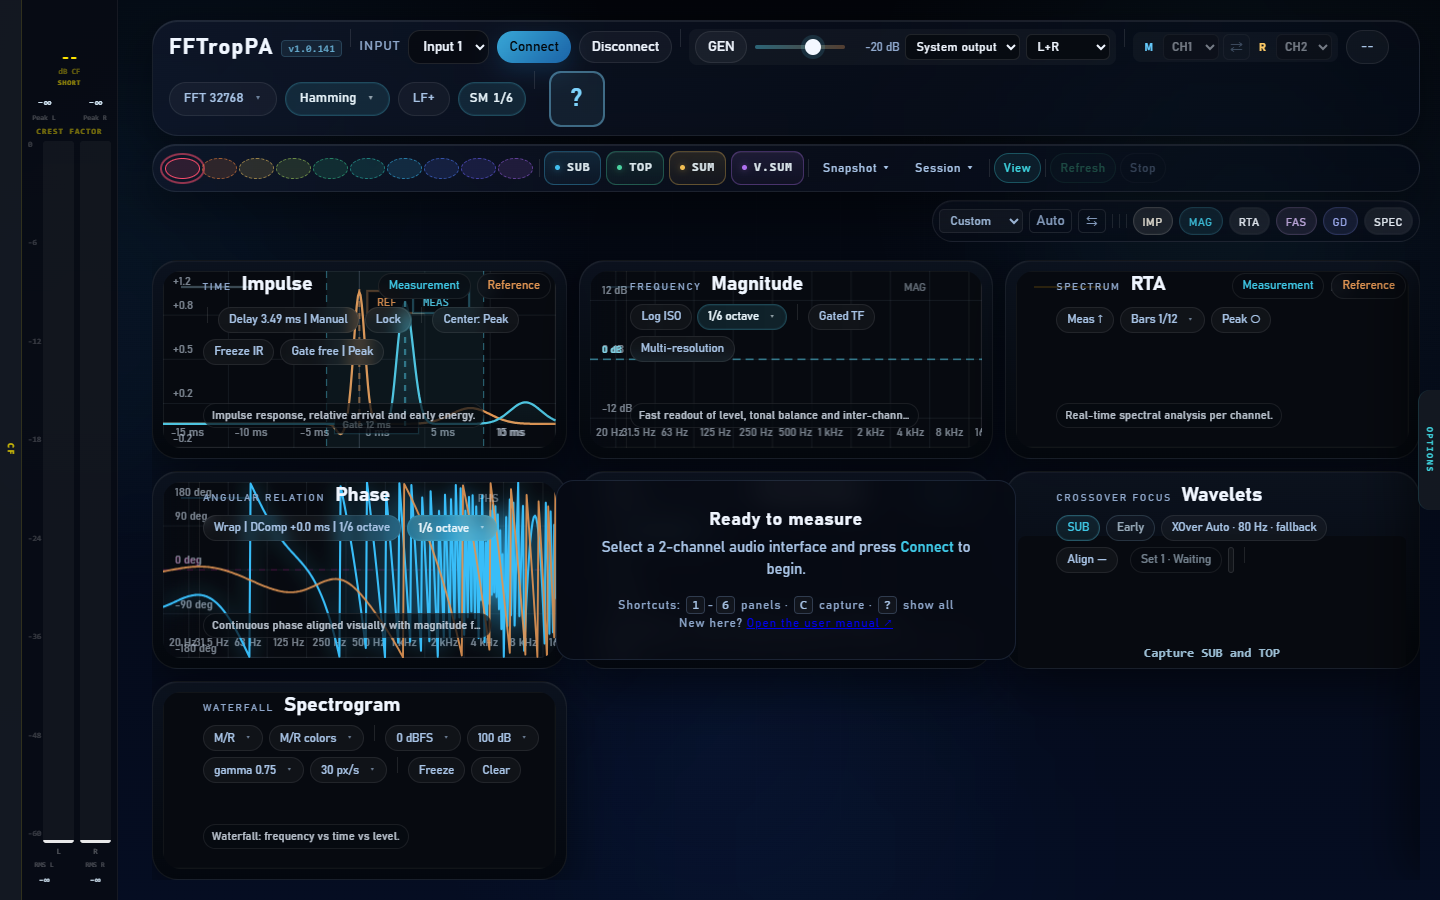
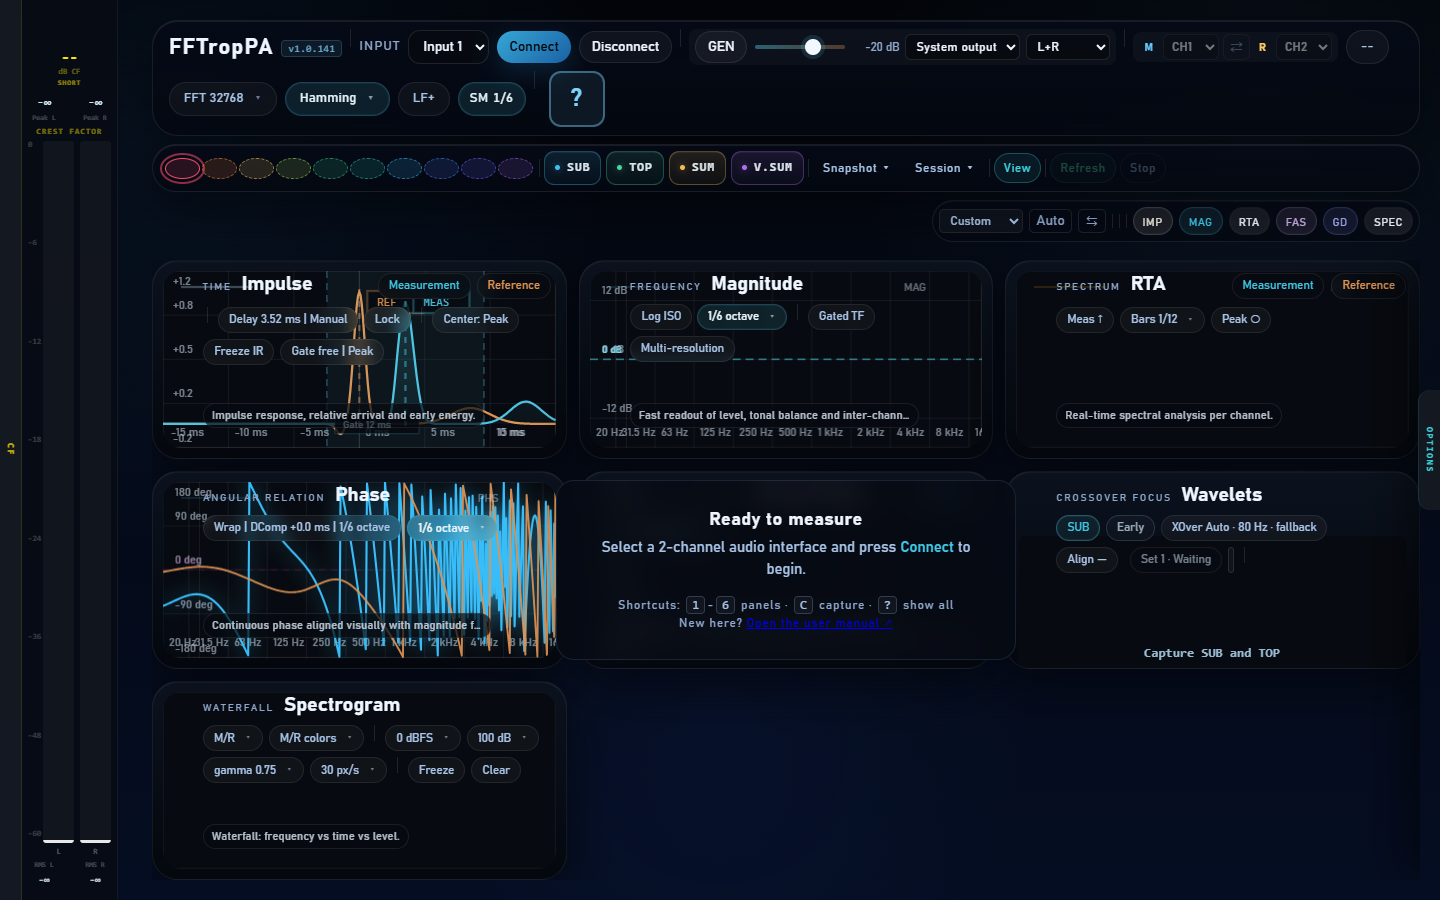
Work mode
Toggled with W. Reduces visual effects (glow, blur, ambient animations) and raises contrast for use in bright environments or on slower machines. The setting is remembered between sessions.
The other operating modes — Auto Idle, Auto Refresh, Gated TF, Multi-resolution (MTW), Delay lock, Hold IR and Gate lock — are documented where their control lives (the panel chip rows) and listed in the keyboard shortcuts table.
Keyboard shortcuts
Shortcuts are inactive while typing in a text field, dropdown or other editable element.
| Key | Action |
|---|---|
| 1 – 6 | Toggle the matching panel (6 = spectrogram) |
| ⇧7 | Toggle the CWT scalogram panel |
| 8 | Show / hide the Crest Factor Meter |
| ⇧1 – ⇧5 | Apply a view preset |
| Space | Refresh TF/RTA integration |
| S | Stop / resume render |
| C | Capture snapshot |
| H | Freeze IR |
| G | Gate center lock |
| L | Lock delay |
| D | Toggle delay compensation |
| F | Toggle frequency scale (log/lin) |
| O | Cycle layout orientation |
| P | Toggle generator |
| W | Toggle work mode |
| ? | Show shortcut cheat sheet in status |
| Esc | Close menus |
| dblclick on slider | Reset to default |